37 Modeling Absorption and Emission Spectra (Assignment)
Janice Hester

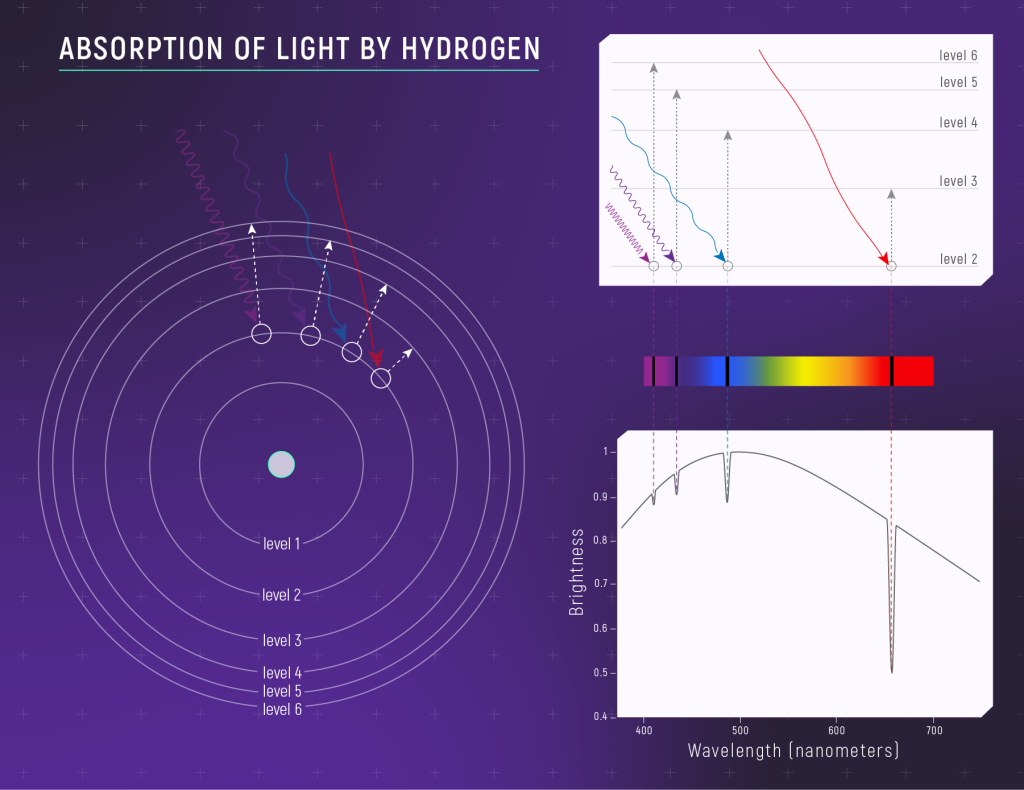
Energy levels are often modeled as either concentric circles (left-hand diagram in the figure above) or a series of horizontal lines or “steps” (upper right). In the concentric-circle model, the further away an energy level is from the nucleus, the higher its energy is. Electrons must gain energy to move out energy levels (to higher energy levels) and they loose energy when they move in energy levels (to lower energy levels). Arrows indicate a transition, or a change in an electron’s energy level. The four arrows in the figure above indicate that an electron is moving from energy level 2 out to higher energy levels (by absorbing a photon).

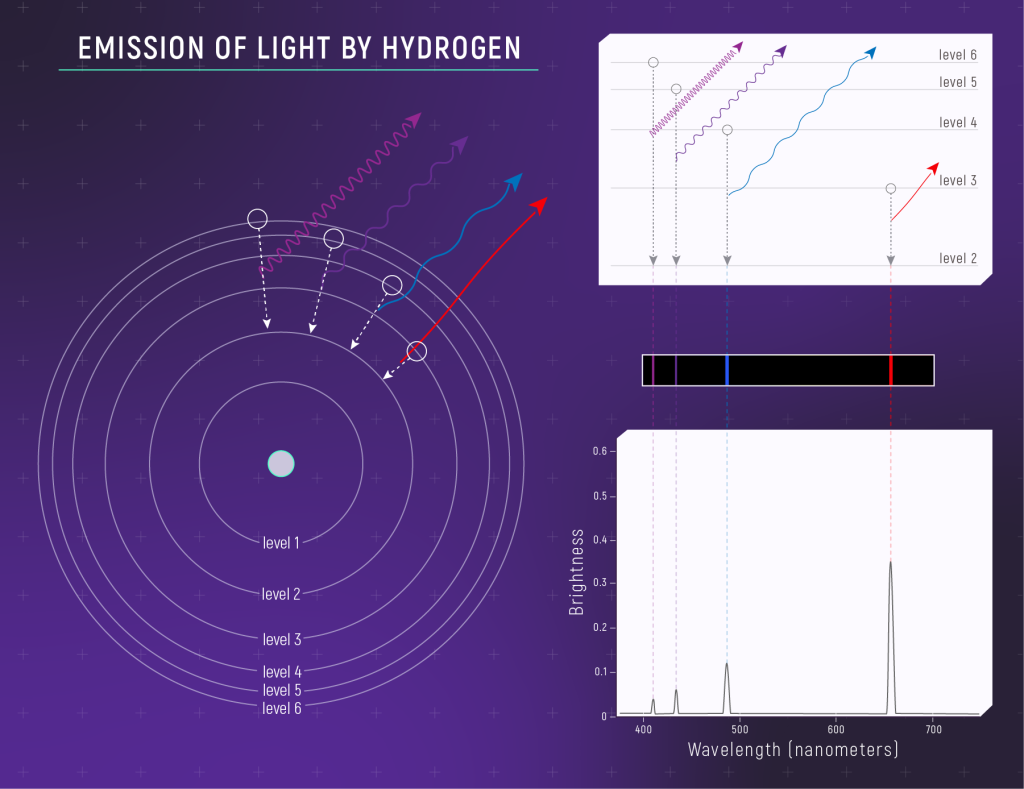
When an electron drops down to a lower energy level; a photon is emitted. This is diagrammed by showing an arrow pointing inward from the original energy level to the new energy level.
Emission Spectrum of Hydrogen
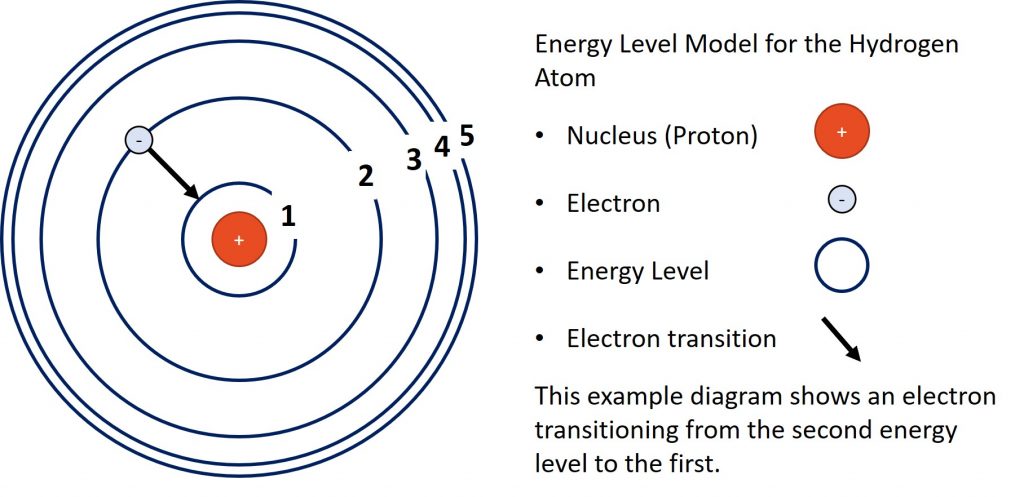
Hydrogen Energy Levels

The diagram above represents the energy levels of a hydrogen atom with a single transition shown. In the transition in the diagram, the electron is loosing energy as it drops from the second energy level to the first.
Absorption Spectrum of a Model Atom

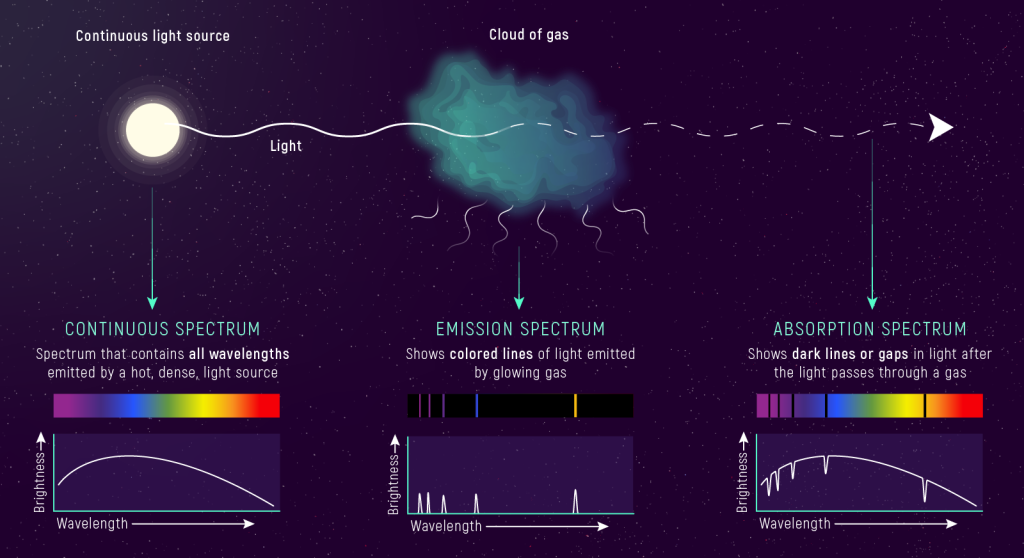
An element’s absorption spectrum is formed when a continuous spectrum passes through a gas of the element. The atoms absorb photons and an electron in the atom transitions to a higher energy level (energy is transferred from the photon to the electron in the atom). The absorption lines in the spectrum correspond to the allowed changes in energy between the energy levels.
