"

31 Spectra (Graded Reading)

Janice Hester

There are two types of light that we can observe from any object. The first is reflected light. Most of the light we see is created by the Sun, a light bulb, a screen, or another light source and then reflects off of the objects around us before entering our eyes.

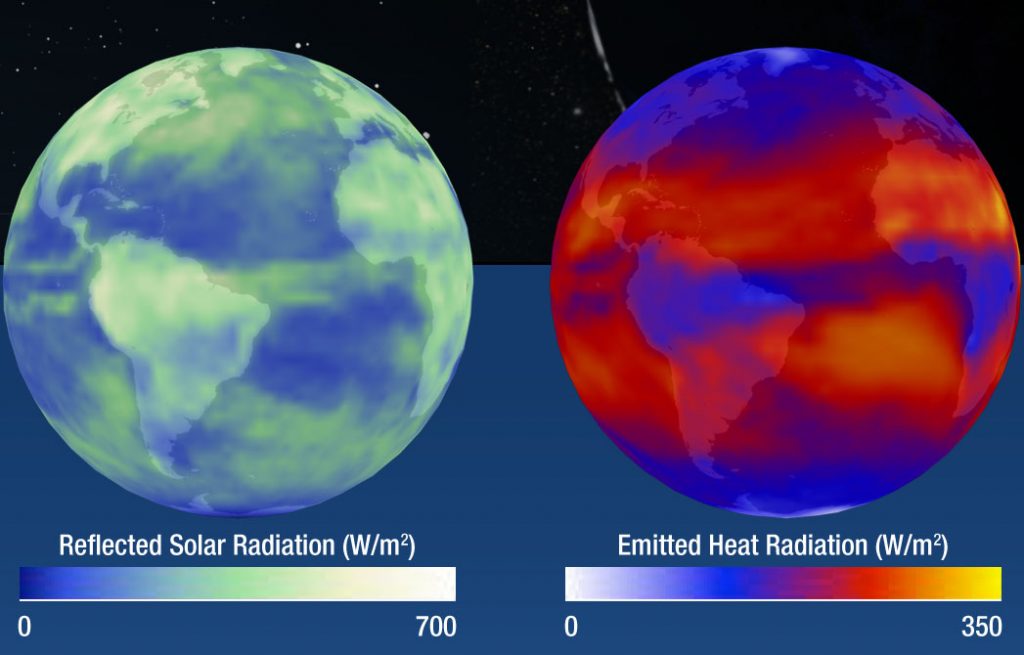
The other type of light is light that is radiated by an object itself.  In our solar system, the Sun is the most obvious example of an object radiating its own light, but it isn’t the only one.  Light is created whenever a charged particle accelerates.  For example, all dense objects emit thermal radiation that is created by the random thermal motions of the object’s atoms and molecules. People and animals, with body temperatures around 310 K, radiate at wavelengths around 9 microns. You can see this light with an infrared (IR) camera. The Earth, with an average surface temperature of 288 K also emits thermal radiation in the IR. The image below shows sunlight reflected from the Earth’s atmosphere and surface (visible light) and thermal emission from the Earth’s atmosphere and surface (IR light).


Reflected solar radiation and emitted head radiation from the Earth as measured by NASA's CERES instrument
Reflected solar radiation and emitted head radiation from the Earth as measured by NASA’s CERES instrument; https://ceres.larc.nasa.gov/

The light reflected by, absorbed by, and emitted by planets, stars, nebulae, galaxies, etc. is the primary way that we learn about these objects.  Within our own solar system, missions have sampled the atmospheres and surfaces of other worlds, analyzed meteorites and sample returns, and recorded martian earthquakes, but we always start by observing light.

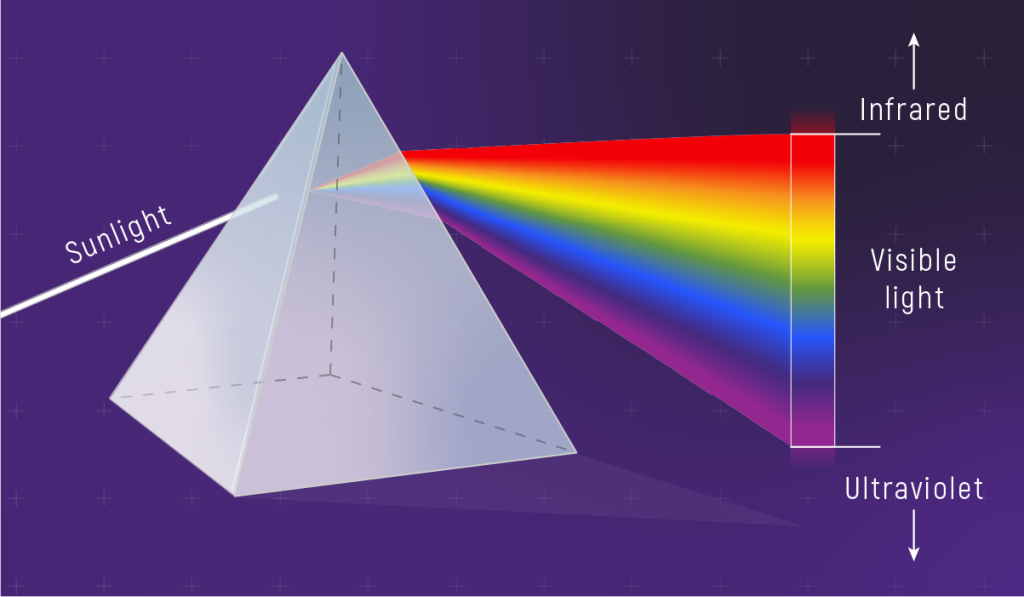
To learn the most from the light coming from an object, we spread the light out into a spectrum.  The different wavelengths of light are separated and the intensity of light in each wavelength is measured.  Splitting light into a spectrum (separating it by wavelength) can be done with a prism or a diffraction grating.  The prism works on optics principles, the bending of light rays of different wavelengths as they pass into and out of the glass prism.  The grating takes advantage of the wave properties of light; different wavelengths (colors) of light passing through the narrow lines in the grating interfere constructively and destructively at different angles.  Both technologies separate light into its different wavelengths.


Sunlight that passes through a prism naturally separates into its component colors in a very specific order—rainbow order—based on wavelength. (Red light waves are longest, and violet light waves are shortest.) This rainbow is known as the visible spectrum. In addition to visible light, sunlight also contains significant amounts of infrared and ultraviolet light, both of which are invisible to human eyes.
White light entering a prism is spread out into a rainbow, from red light (longer wavelength) to blue light (shorter wavelength).  Illustration credit: NASA, ESA, Leah Hustak (STScI)

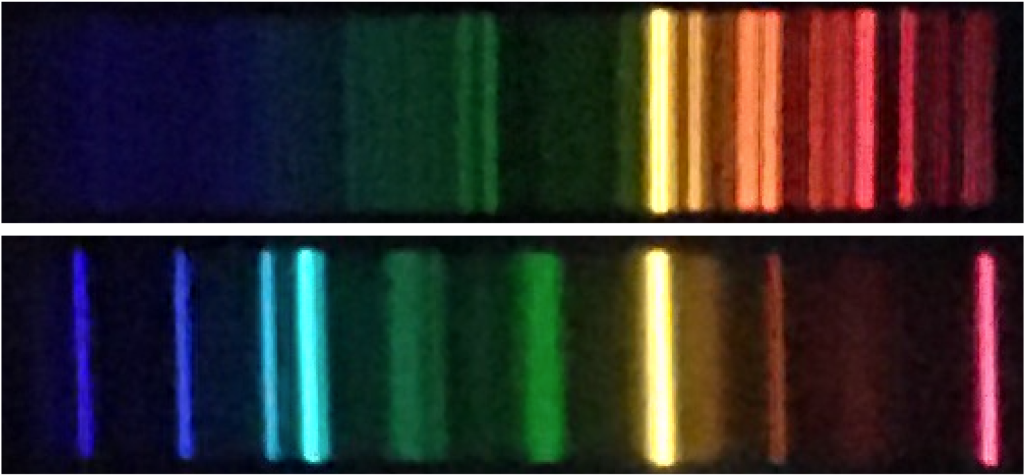
The spectrum of a object can be represented in two ways.  The first is a colored band that shows what you would see if you looked at the spectrum.  The images below are example spectra taken through a spectral viewer; these are the type of spectra you might observe in an introductory astronomy lab. Notice that not all wavelengths of light are present in these spectra.  For example, both of the sources used to create these spectra emit strongly (emit a lot of light) around a particular yellow wavelength, but many wavelengths of blue light are missing.


Examples of spectra seen in an astronomy lab
Examples of spectra observed in a student lab.


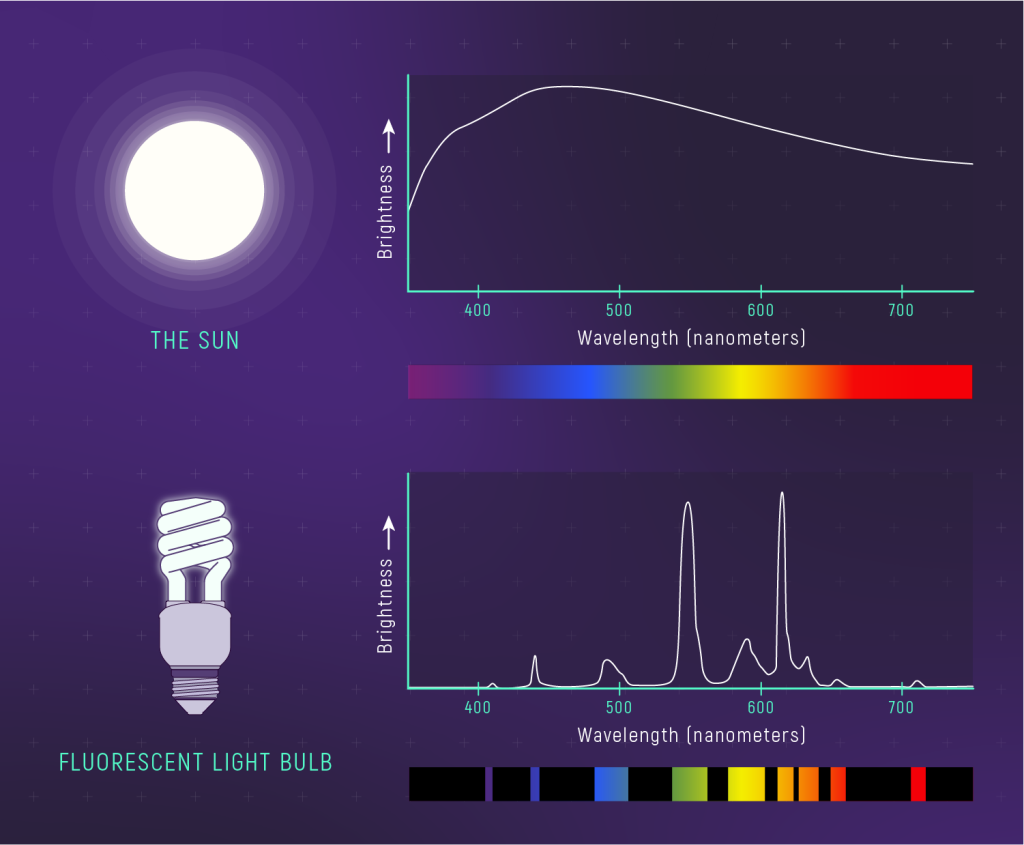
The other way to represent a spectrum is as a graph of brightness (really intensity) versus wavelength. The figure below shows a picture of the spectrum (what you would observe) alongside a graph of the spectrum for two different light sources. The spectrum of sunlight is continuous; it contains all visible wavelengths of light; the graph of brightness versus wavelength is smooth and unbroken.  A compact fluorescent light bulb doesn’t emit all wavelengths of light.  The spectrum is made up of broad bars of color, which show up as peaks in the spectrum’s graph.


A comparison of the spectrum of the Sun (top half of the graphic) to the spectrum of a fluorescent light bulb (bottom half of the graphic). The two spectra are distinctly different: The spectrum of sunlight is shown as a continuous curve and rainbow. The spectrum of the light bulb consists of a set of discrete sections, shown as peaks on the graph and bands of color in the picture.Top Half: Continuous Emission Spectrum of the Sun    On the left, the Sun is illustrated as a bright, solid white circle surrounded by semi-transparent rings of white.    On the right is a graph of brightness on the vertical y-axis versus wavelength in nanometers on the horizontal x-axis. The y-axis has an arrow pointing upward to indicate that brightness increases from the bottom to the top of the graph. There are no numbers, units, or tick marks on the y-axis. The x-axis ranges from 350 nanometers at the origin to 750 nanometers at the far-right end, with labeled tick marks every 100 nanometers.    The curve representing the continuous spectrum of sunlight is concave down with a shape resembling the top front part of a whale as seen from the side: The curve begins about halfway up the y-axis and continues upward with a concave down shape to a broad peak at the top of the graph at about 450 nanometers. It then decreases gradually to the right, leveling out at about 700 nanometers. There are no sharp peaks or valleys superimposed on the overall shape of this curve. (The detailed absorption features of the solar spectrum are not shown.)    Below the graph of the solar spectrum is a picture of the spectrum in the form of a long horizontal bar with rainbow coloring aligned with x-axis of the graph above. The rainbow ranges from purple on the far left to red on the far right. The rainbow is continuous, with no black lines or missing segments.  Bottom Half: Emission Spectrum of a Fluorescent Light Bulb    On the right is a simple illustration of a solid white spiral-shaped fluorescent light bulb.    On the left is a graph of brightness versus wavelength in nanometers. The scale and labels are the same as the graph showing the solar spectrum: Brightness increases from the bottom to the top. Wavelength ranges from 350 nanometers at the origin to 750 nanometers at the far right.    The spectrum of the light bulb consists of nine distinct peaks of different height and width, with no overall trend. From left to right the peaks appear at roughly: 405, 435, 490, 550, 580, 610, 630, 650, and 710 nanometers. The highest peaks are at 550 and 610 nanometers.    Below the graph is a picture of the emission spectrum in the form of a long horizontal bar aligned with the x-axis of the graph. Unlike the continuous rainbow of sunlight, this picture shows a series of discrete bands of color, separated by bands of black. The color bands correspond to the peaks on the graph. From left to right (shortest to longest wavelength) they are: purple, purplish blue, blue, greenish-yellow, yellow, yellow-orange, orange, orange-red, and red.
Two representation of the visible light spectrum for the Sun and a CFL bulb. Illustration credit: NASA, ESA, Leah Hustak (STScI)


Concept Check

License

Astronomy Extras and Interactives Copyright © by Janice Hester. All Rights Reserved.