35 Spectral Lines and Elements (Graded Reading)
Janice Hester
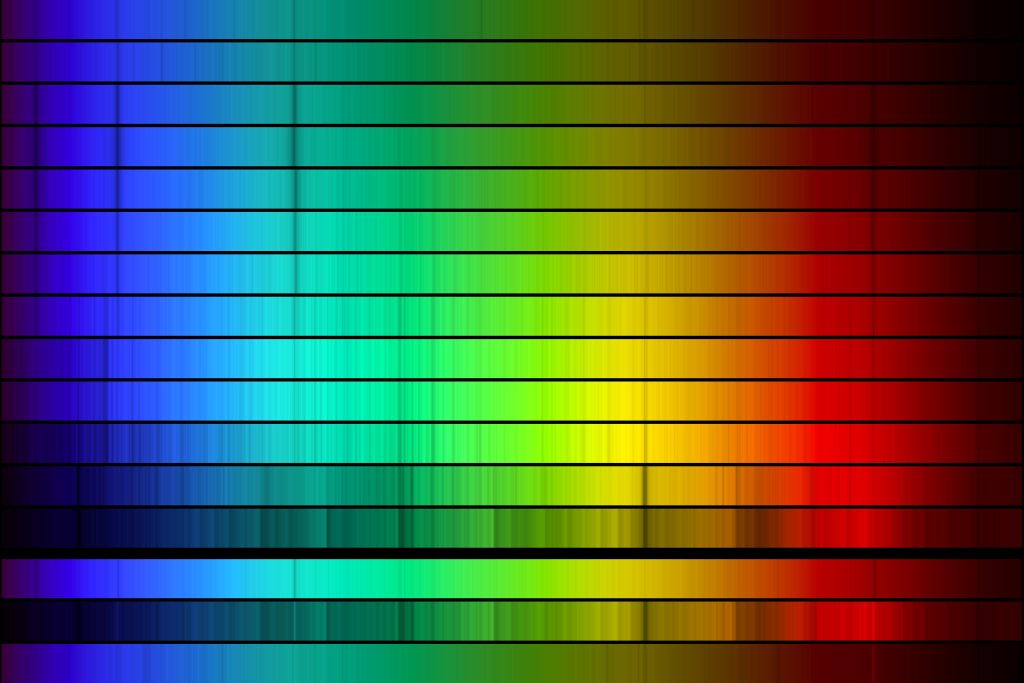
When the spectra of stars of different temperatures are displayed together (figure above), many of the absorption lines appear at the same wavelengths across multiple spectra. For example there are strong (dark and wide) absorption lines in blue, teal, and red in some of the hottest stars (top of the figure). These lines are created by the elements and molecules in the stars’ atmospheres, and their presence in stellar spectra help us learn about the composition of stars (i.e., to figure out what stars are made of).
Periodic Table of Spectra
In a fluorescent light bulb, a voltage is applied across a low density gas, causing the gas to fluoresce or glow. The color of the fluorescence depends on the atoms and molecules that make up the gas. Neon glows a bright red (the original neon signs were filled with neon); hydrogen glows a pinkish purple.
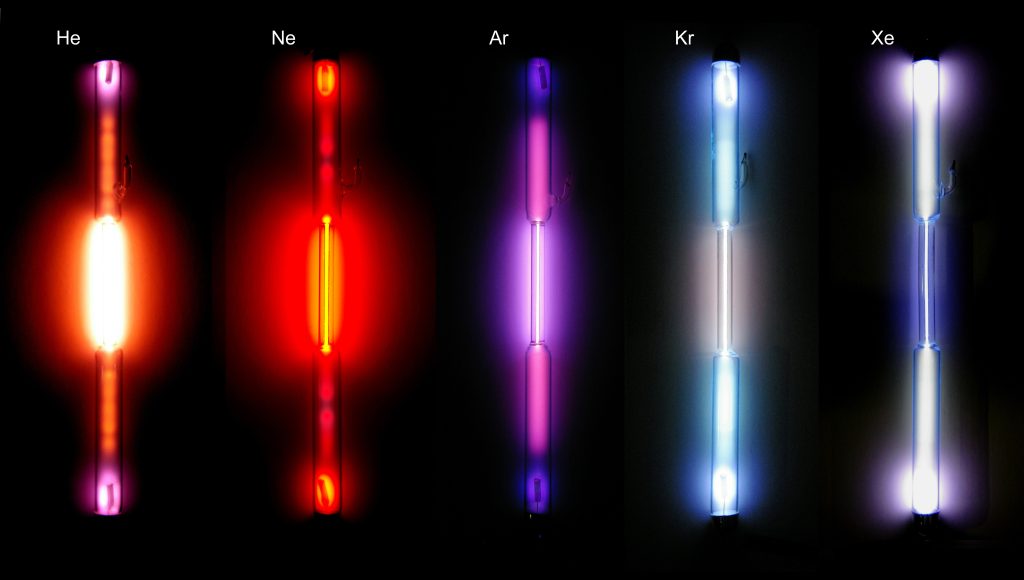
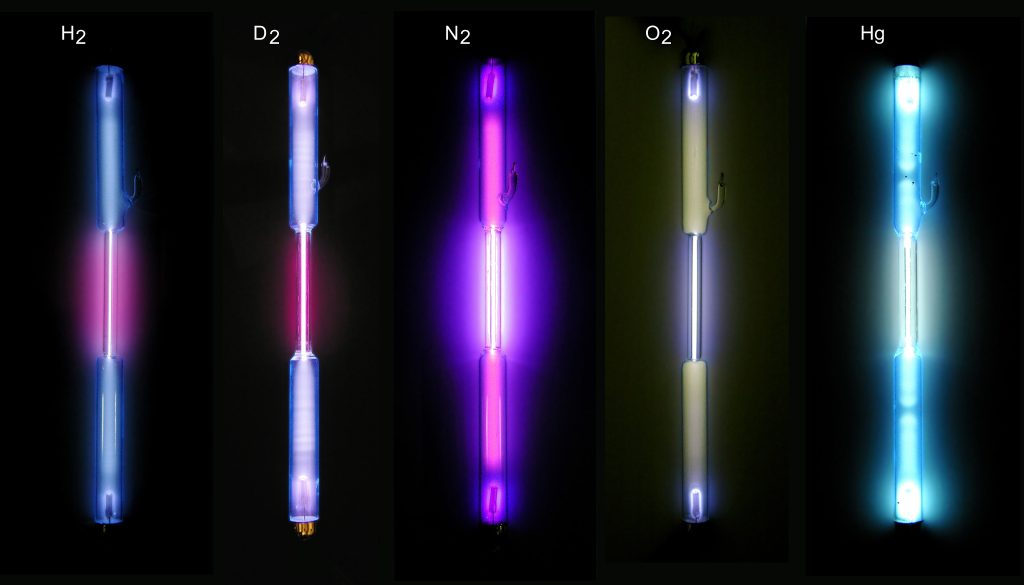
When the light from one of these bulbs is passed through a grating to form a spectrum, we see that most of the light comes from emission lines. The example spectra from an introductory astronomy laboratory shown below are from fluorescent light bulbs filled with two different elements.
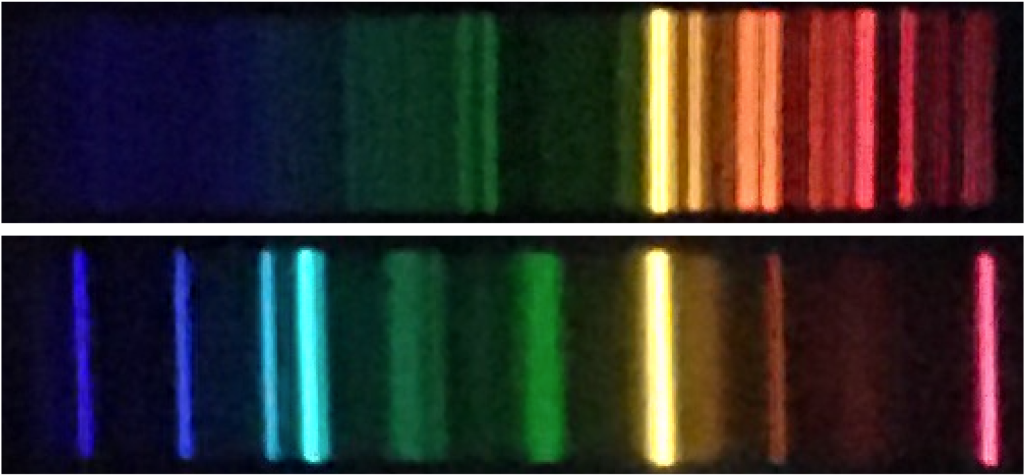
Answer the following question based on knowledge from a previous science class. If you do not know the answer to this question, please look it up.
You can see the emission line spectra for all of the elements at this webpage (Interactive Atomic Spectra). If you click one of the elements, its spectra appears. Use this tool to answer the following questions.
Each element has its own unique set of emission lines. By comparing the spectrum of an unknown gas to the spectra of various elements we can identify the element, or elements, that the unknown gas is made of.
Absorption Lines
When light with a continuous spectrum (light that contains all visible wavelengths of light) is passed through a gas, an absorption spectrum is created. Instead of emitting photons, the gas is now absorbing photons from the light passing through it. (Viewed from a different angle, the same gas will glow — producing an emission spectrum — as it re-emits the light that it absorbed.)
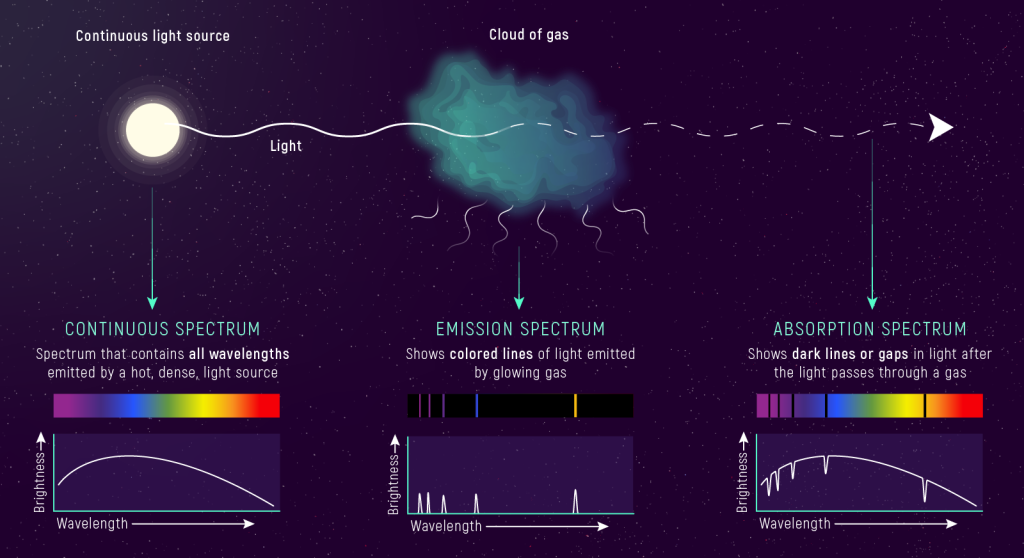
When the emission and absorption spectra from an element are compared, we see that each element absorbs light of the same wavelengths that it emits. For example, hydrogen has four visible emission lines (violet, deep blue, blue-green, and red). These four lines appear in both the emission and absorption spectra of hydrogen (figure below). (Hydrogen also has emission and absorption lines in UV and IR.) From a photon view, atoms absorb photons of the same energies as those that they emit.

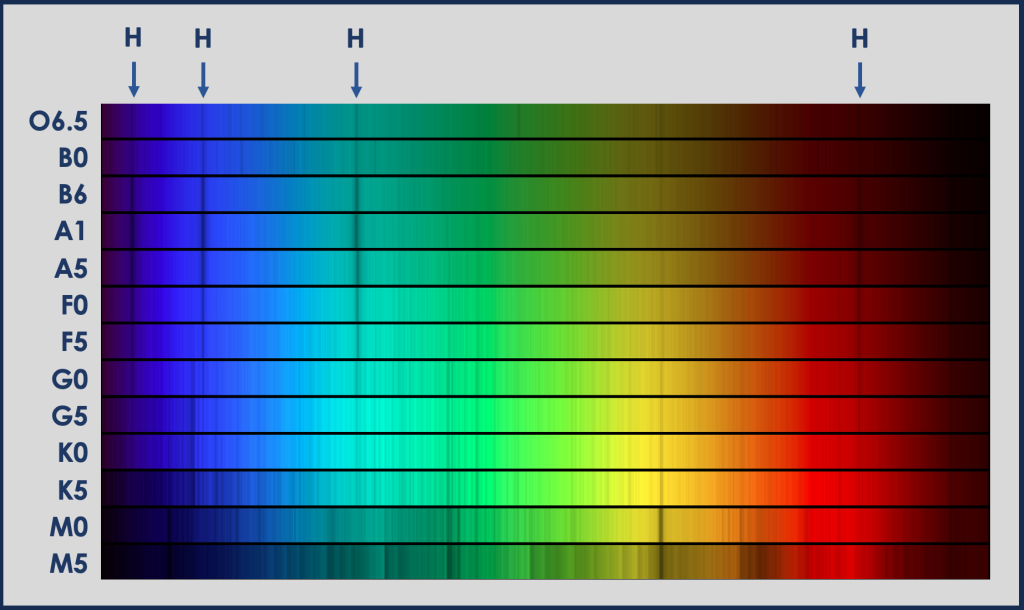
Returning to the spectra of stars, we can now see that some of the absorption lines in stellar spectra are caused by hydrogen in the star’s atmosphere absorbing light (four absorption lines marked in the figure above). All stars are made up mostly of hydrogen, but the absorption lines are strongest in stars of a certain temperature. Stellar spectra were originally classified by the strength of these lines; they are strongest in A stars, clear in B and F stars, and weaker in stars of other stellar types. Helium, oxygen, and sulfur cause some of the other strong lines in stellar spectra. The coolest stars (which have many absorption lines) also have absorption lines from molecules.
