
Section SV.3 – Venn Diagrams
To visualize the interaction of sets, John Venn in 1880 thought to use overlapping circles, building on a similar idea used by Leonhard Euler in the 18th century. These illustrations are now called Venn Diagrams.
| Venn Diagram |
|
A Venn diagram represents each set by a circle, usually drawn inside of a rectangle. The rectangle represents the universal set. Overlapping areas of circles indicate elements common to both sets. Note: There is no meaning to the size of the circle. Basic Venn diagrams can illustrate the interaction of two or three sets. |
| Example 1 | |
|
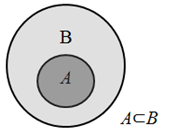
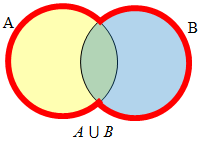
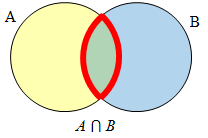
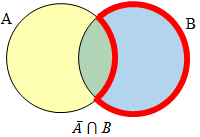
Create Venn diagrams to illustrate A ⊂ B , A ⋃ B, A ⋂ B, and A̅ ⋂ B |
|
|
A ⊂ B means that A is a proper subset of set B. So all elements in set A are also elements in Set B.
|
A ⋃ B contains all elements in either set. The elements can be in set A or set B or both.
|
|
A ⋂ B contains only those elements in both sets – in the overlap of the circles. The elements are in set A and set B.
|
A̅ will contain all elements not in the set A.
A̅ ⋂ B will contain the elements in set B that are not in set A.
|
| You Try SV.3.A |
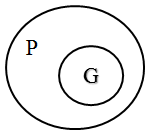
| Draw a Venn Diagram to represent that set G is a proper subset of set P. |
| Example 2 |
|
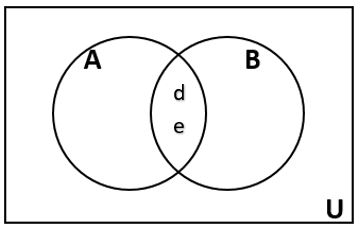
Draw a Venn Diagram to represent the sets U = {a, b, c, d, e, f, g}, A = {a, b, d, e}, and B = {d, e, g}. |
| We’ll start by identifying all the elements in the set A ⋂ B. This means all the elements in set A and set B.
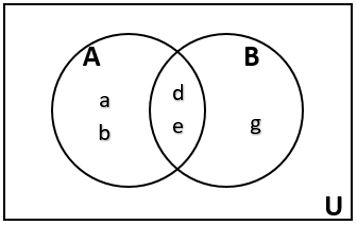
Now, write the remaining elements of A inside the region A but outside the intersection of A and B. Do the same for the remaining elements of B.
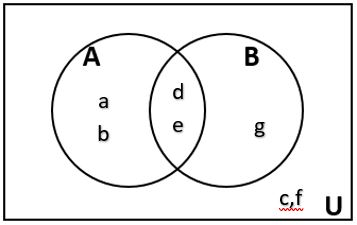
Now, complete the Venn Diagram by writing any elements from the universal set that were not in A or B.
|
| Example 3 |
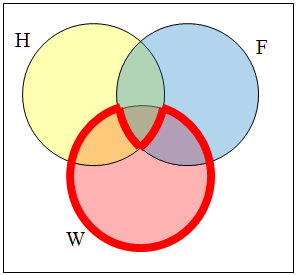
| Use a Venn diagram to illustrate [latex]\overline{(H~\cap~F)}~\cap~W[/latex]. |
|
We’ll start by identifying everything in the set H ⋂ F
Now, [latex]\overline{(H~\cap~F)}~\cap~W[/latex] will contain everything not in the set identified above that is also in set W.
|
| Example 4 |
|
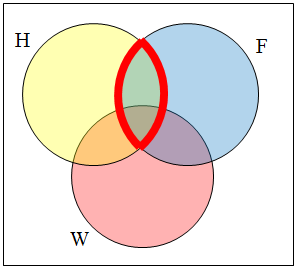
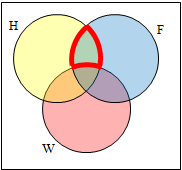
Create an expression to represent the outlined part of the Venn diagram shown.
|
|
The elements in the outlined set are in sets H and F, but are not in set W. So we could represent this set as H ⋂ F ⋂ W̅ |
| You Try SV.3.B |
|
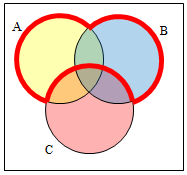
Create an expression to represent the outlined portion of the Venn diagram shown below.
|
| Example 5 |
|
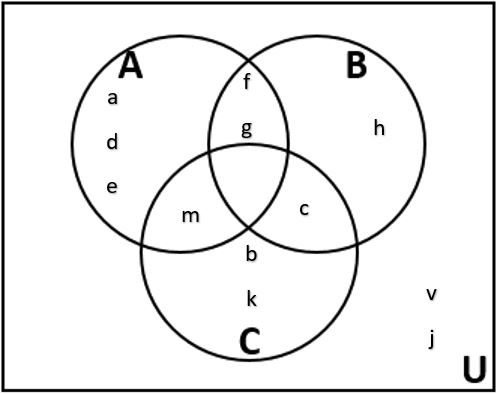
Use the Venn diagram to write each of the sets below in roster form.
|
| • A =
All the elements in the circle A: {a, d, e, f, g, m} • A ∪ B = All the elements in the circles A and B: {a, d, e, f, g, m, h, c} • [latex]\overline{A~\cup~B~\cup~C}[/latex] = All the elements that are not in A, B or C: {v, j} • A ∩ B ∩ C = All the elements that are in all three sets. The center region where all three sets overlap is empty: { } or ∅ • (A ∪ B) ∩ C̅ = We need the elements in A or B combined and not in C: {a, d, e, f, g, h} |
Section SV.3 – Answers to You Try Problems
SV.3.A
G is a proper subset of P, so G must be completely contained within P.
SV.3.B
(A ∪ B) ∩ C̅
