Section SV.4 – Cardinality
Often we are interested in the number of items in a set or subset. This is called the cardinality of the set.
| Cardinality |
|
The number of elements in a set is the cardinality of that set. The cardinality of the set A is often notated as n(A). |
| Example 1 |
|
Let A = {1, 2, 3, 4, 5, 6} and B = {2, 4, 6, 8}. Find the following: n(B ) n(A ⋃ B ) n(A ⋂ B ) |
|
n(B ) = 4, since there are 4 elements in the set. Since A ⋃ B = {1, 2, 3, 4, 5, 6, 8}, which contains 7 elements, n(A ⋃ B ) = 7. Since A ⋂ B = {2, 4, 6}, which contains 3 elements, n(A ⋂ B ) = 3 |
| Example 2 |
|
Find n(P), where P = the set of English names for the months of the year? |
|
n(P) = 12, since there are 12 months in the year. |
| Example 3 |
|
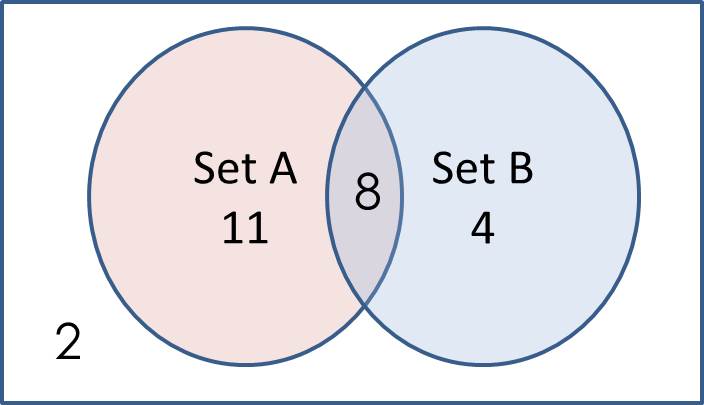
Consider the Venn diagram below Determine [latex]n(A)[/latex], [latex]n(\bar{B})[/latex], [latex]n(\bar{A})[/latex], [latex]n(A~\cup~B)[/latex], [latex]n(B)[/latex], [latex]n(A~\cap~\bar{B})[/latex]
|
|
[latex]n(A)[/latex] = 11 + 8 = 19 [latex]n(\bar{B})[/latex] = 11 + 2 = 13 [latex]n(\bar{A})[/latex] = 2 + 4 = 6 [latex]n(A~\cup~B)[/latex] = 11 + 8 + 4 = 23 [latex]n(B)[/latex] = 8 + 4 = 12 [latex]n(A~\cap~\bar{B})[/latex] = 11 |
Sometimes (as in the previous example) we may be interested in the cardinality of the union or intersection of sets, but not know the actual elements of each set. This is common in surveying applications like the ones below. To help solve problems like this we will often draw Venn diagrams where we label the regions with the number of elements in it (as in the previous example). When you read a Venn diagram it is important identify if it is illustrating the cardinality of the regions or the elements of the region. You will be able to tell from the context of the problem.
| Example 4 |
|
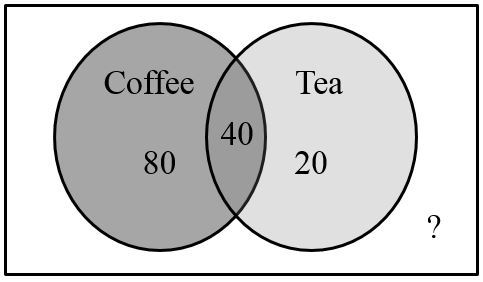
A survey asks 200 people “What beverage do you drink in the morning?”, and offers choices:
Suppose 20 report tea only, 80 report coffee only, 40 report both. How many people drink tea in the morning? How many people drink neither tea nor coffee?
|
|
We can also see that those who drink neither are those not contained in the any of the three other groupings, so we can count those by subtracting from the cardinality of the universal set, 200. 200 – 20 – 80 – 40 = 60 people who drink neither. |
| Example 5a |
|
A survey asks: Which online services have you used in the last month:
The results show 42% of those surveyed have used Twitter, 70% have used Facebook, and 20% have used both. What percentage of people have used neither Twitter nor Facebook? |
|
Let T be the set of all people who have used Twitter, and F be the set of all people who have used Facebook. Notice that while the cardinality of F is 70% and the cardinality of T is 42%, the cardinality of F ⋃ T is not simply 70% + 42%, since that would count those who use both services twice (they were added in as Twitter users, and added in again as Facebook users). To find the cardinality of F ⋃ T, (the number of people who used Facebook or Twitter) we can add the cardinality of F and the cardinality of T, then subtract out those in intersection that we’ve counted twice (those who used both Facebook and Twitter). In symbols, n(F ⋃ T) = n(F) + n(T) – n(F ⋂ T) n(F ⋃ T) = 70% + 42% – 20% = 92% We now know that 92% of those surveyed used Facebook, or Twitter, or both. Now, to find how many people have not used either service, we’re looking for the cardinality of [latex]\overline{(F~\cup~T)}[/latex]. Since the universal set contains 100% of people and the cardinality of F ⋃ T = 92%, the cardinality of [latex]\overline{(F~\cup~T)}[/latex] must be the other 8%. The Venn diagram for this situation would look like this:
|
The previous example illustrated two important properties:
| Cardinality properties |
|
n(A ⋃ B) = n(A) + n(B) – n(A ⋂ B) n(A̅) = n(U) – n(A) Notice that the first property can also be written in an equivalent form by solving for the cardinality of the intersection: n(A ⋂ B) = n(A) + n(B) – n(A ⋃ B) |
We can also use another technique for drawing Venn diagrams to model real life data. Consider the previous example again:
| Example 5b – Repeat of previous example (alternate technique) |
|
A survey asks: Which online services have you used in the last month:
The results show 42% of those surveyed have used Twitter, 70% have used Facebook, and 20% have used both. What percentage of people have used neither Twitter nor Facebook? |
|
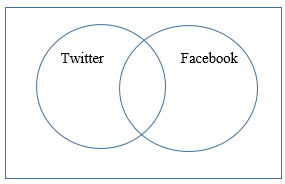
We solved this problem previously using the cardinality formulas, but some students appreciate a more visual approach which is what will be presented here. Before specifically looking at what question we are trying to answer, we will just work through drawing the Venn diagram to model the situation. We know the basic structure will look like this:
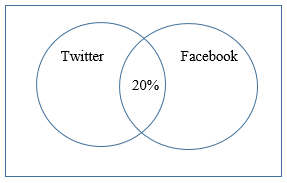
When modeling with a Venn diagram, ALWAYS START IN THE MIDDLE (in other words, the intersection of your sets). We know that the portion of the diagram where the two circles overlap represents the intersection of the two sets (people who used both Twitter and Facebook). In this case, that is 20%. We start by labeling that part of the Venn diagram.
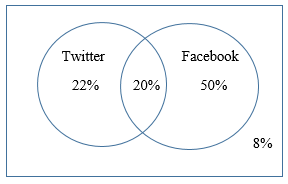
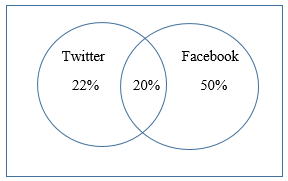
We now start working our way out. We know that the ENTIRE Twitter circle contains 42% of those surveyed, but we already know where 20% of them are (in the intersection that we just labeled). That leaves 42% – 20% = 22% who used Twitter ONLY. Using the same logic, of the 70% who used Facebook we know 20% used both Facebook and Twitter. That leaves 70% – 20% = 50% who used Facebook ONLY. The updated Venn diagram now looks like this:
Finally, since the universal set contains 100% of people surveyed, the percentage who used neither Twitter nor Facebook must be 100% – 22% – 20% – 50% = 8%. The final Venn diagram for this situation would look like this:
8% of people have used neither Twitter nor Facebook. |

| You Try SV.4.A |
|
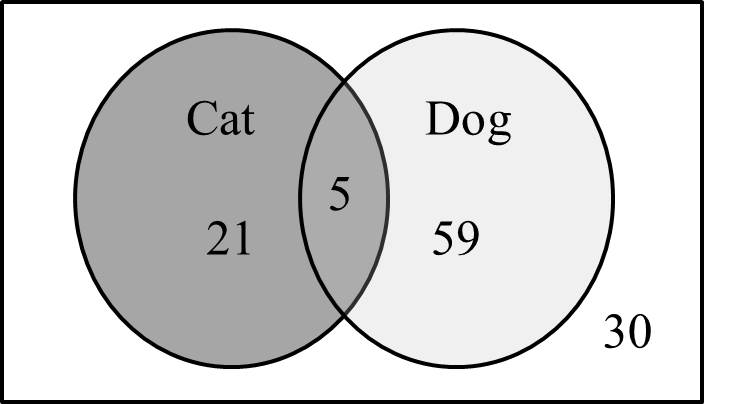
In a survey of 115 pet owners, 26 said they own a cat, and 64 said they own a dog. 5 said they own both a dog and a cat. Use a Venn diagram to determine how many of the pet owners surveyed owned neither a cat nor a dog?
|
Consider the following additional examples of using Venn diagrams to model real life scenarios with three sets, instead of two.
| Example 6 |
|
A group of adults was surveyed about the types of movies they enjoyed watching. The results were as follows: 30 enjoyed watching only Action movies 46 enjoyed watching only Family movies 42 enjoyed watching only Comedy movies 57 enjoyed watching only Action and Family movies 82 enjoyed watching only Action and Comedy movies 23 enjoyed watching only Family and Comedy movies 27 enjoyed watching all three 13 enjoyed watching none of these types of movies Draw a Venn diagram to model this situation, and use it to determine how many total adults were surveyed, and how many of those surveyed enjoy Family movies. |
|
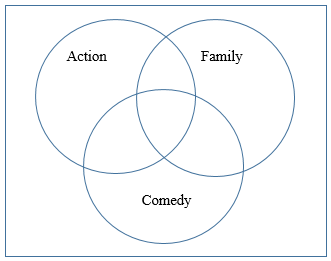
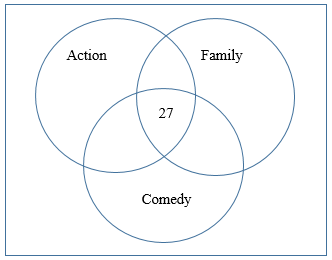
We have three sets to include in our Venn diagram: those who enjoy Action movies, those who enjoy Family movies, and those who enjoy Comedy movies. The initial set up for this Venn diagram looks like this:
As in the previous example, we will start in the middle of the diagram, first labeling the cardinality for the intersection of all three sets. This represents those who enjoy Action, Family, and Comedy movies. According to the survey data, this was a total of 27 people. At this point, the Venn diagram looks as follows:
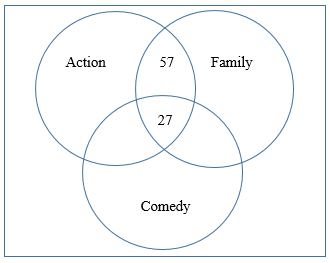
As is the case in Venn diagrams, once we have labeled in the center, we start working our way out of the middle. Consider where the Action and Family circles overlap. We are told that “57 enjoyed watching only Action and Family movies”. The wording “only” here is important to notice. When we use the word “only”, we are describing only that portion of the Venn diagram where Action and Family overlap (NOT INCLUDING COMEDY). The Venn diagram at this point becomes:
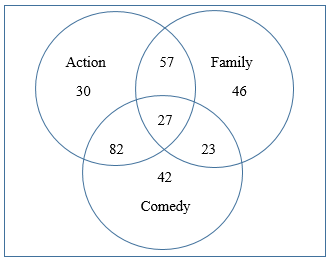
Continuing with the same idea, we can fill in the remaining segments in the Venn diagram. Again, it is important to note that this process works due to the word “only” being used to describe each portion of the data set.
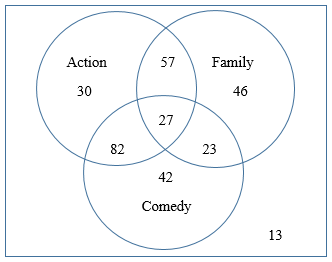
Finally, we know 13 people enjoyed watching none of these types of movies. That means those 13 are in the universal set of those surveyed, but not inside any of the three sets. The finished Venn diagram looks as follows:
To answer the question of how many total adults were surveyed, we add up all the numbers from the Venn diagram. 30 + 57 + 46 + 82 + 27 + 23 + 42 + 13 = 320 adults were surveyed To answer the question of how many of those surveyed enjoyed Family movies, we add up all of the numbers inside the Family circle. 46 + 23 + 27 + 57 = 153 adults enjoyed Family movies |
| Example 7 |
|
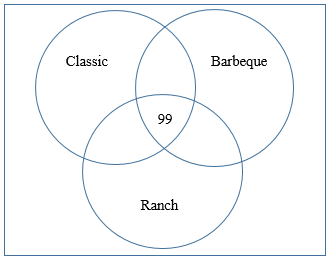
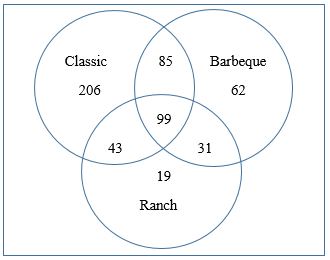
In a survey of 556 adults about consumer preferences for flavors of potato chips, the following results were obtained: 433 buy classic chips 277 buy barbecue chips 192 buy ranch chips 184 buy classic and barbecue chips 142 buy classic and ranch chips 130 buy barbecue and ranch chips 99 buy all three flavors Use this information to draw a Venn diagram, and determine how many people don’t buy any of these varieties of chips.
|
|
As with the previous example, we will start in the middle, with the intersection of all three sets. There are 99 adults surveyed who buy all three flavors, so 99 goes in the center of the Venn diagram:
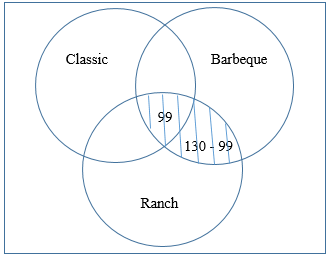
Once we have the number in the intersection of all three sets, we start working our way out from the center. We are told that 130 people buy barbeque and ranch chips. An important distinction to make is that, unlike the last example, we are NOT told that 130 people ONLY buy barbeque and ranch. The 130 people that buy barbeque and ranch is the shaded area as shown below, and includes the 99 already counted that buy all three.
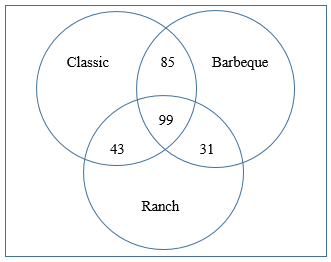
Use this same idea to fill in each of the regions of the Venn diagram where two of the sets overlap. The Venn diagram at this point is as follows:
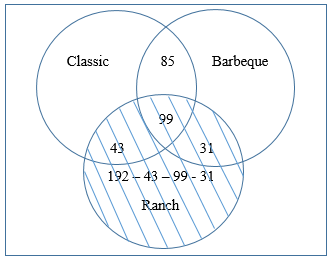
Continue working your way outside, now taking the number of adults in each set individually. We are told that 192 buy Ranch chips. This 192 includes the entire Ranch circle as shaded below (of which, we already have 43, 99, and 31 of the adults accounted for from previous information).
Use this same idea to fill in the remaining segments of the Venn diagram.
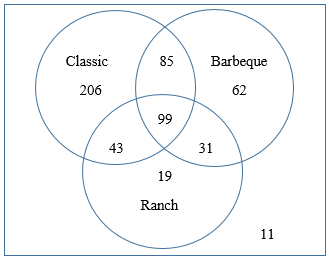
Finally, we know that 556 adults total were surveyed. This piece of information allows us to finish the Venn diagram, and answer the question “How many of those surveyed don’t buy any of these varieties of chips?” Starting with the 556 surveyed, we subtract out all of the numbers from the known segments of the Venn diagram: 556 – 206 – 85 – 62 – 43 – 99 – 31 – 19 = 11 adults don’t buy any of these varieties The final Venn diagram is as follows:
|
Section SV.4 – Answers to You Try Problems
SV.4.A
30 owned neither a cat nor a dog