
Section SV.4 – Practice Problems
1. Let A = {1, 2, 3, 4, 5}, B = {1, 3, 5}, and C = {4, 6}
a. What is the cardinality of A?
b. What is the cardinality of B?
c. What is the cardinality of A ⋃ C ?
d. What is the cardinality of A ⋂ C ?
2. Let A = {1, 5, 9} B = {1, 2, 3, 4, 5, 6, 8} C = {2, 4, 5, 8, 9}
Determine the following:
a. [latex]n(A)[/latex]
b. [latex]n(C)[/latex]
c. [latex]n(B)[/latex]
d. [latex]n(B~\cap~C)[/latex]
e. [latex]n(A~\cup~C)[/latex]
3. Consider the Venn diagram below.
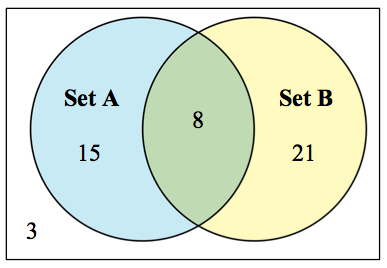
Determine the following
a. [latex]n(A)[/latex]
b. [latex]n(\bar{A})[/latex]
c. [latex]n(B)[/latex]
d. [latex]n(\bar{B})[/latex]
e. [latex]n(A~\cap~B)[/latex]
f. [latex]n(A~\cup~B)[/latex]
g. [latex]n(\bar{A}~\cap~B)[/latex]
4. Consider the Venn diagram below.
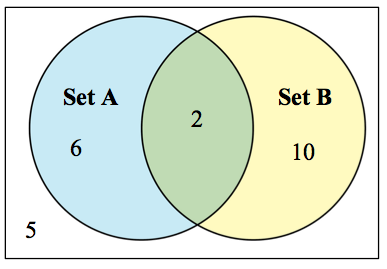
Determine the following
a. [latex]n(A)[/latex]
b. [latex]n(\bar{A})[/latex]
c. [latex]n(B)[/latex]
d. [latex]n(\bar{B})[/latex]
e. [latex]n(A~\cap~B)[/latex]
f. [latex]n(A~\cup~B)[/latex]
g. [latex]n(\bar{A}~\cap~\bar{B})[/latex]
5. Consider the Venn diagram below.
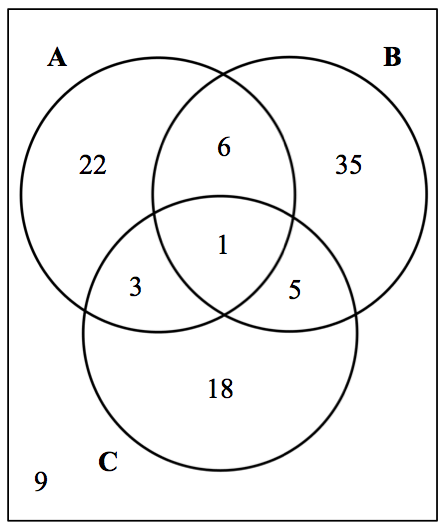
Determine the following
a. [latex]n(A)[/latex]
b. [latex]n(C)[/latex]
c. [latex]n(\bar{B})[/latex]
d. [latex]n(A~\cap~C)[/latex]
e. [latex]n(B~\cup~C)[/latex]
f. [latex]n((B~\cap~C)~\cup~A)[/latex]
6. Out of 60 students, 21 are taking English, 34 are taking Math, and 7 are in both classes.
a. Draw a Venn diagram to organize the information.
b. How many students are in either English or Math?
c. How many students are not in English?
d. How many students are in English and not in Math?
7. Out of 100 students, 57 are Nursing majors, 43 have children, and 21 are Nursing majors who also have children.
a. Draw a Venn diagram to organize the information.
b. How many students are Nursing majors or have children?
c. How many students do not have children?
d. How many students do not have children and are not Nursing majors?
8. Students who take AP English also take the AP exam, of which they either pass or fail. Of the 28 students taking AP English, 10 received an A in the course. Out of the 15 students that passed the AP exam, 9 received an A in the course.
a. Draw a Venn diagram to organize the information.
b. How many students failed the AP exam?
c. How many students passed the AP exam and did not receive an A?
d. How many students failed the AP exam and did not receive an A?
e. How many students passed the AP exam and received an A?
9. A team has 39 baseball games this season. Out of the 22 home games, the team won 14 of them. The team had a total of 25 wins over the entire season.
a. Draw a Venn diagram to organize the information.
b. How many of the away games did the team win?
c. How many of the away games did the team lose?
d. How many of the home games did the team win?
e. How many of the home games did the team lose?
10. In a survey of 90 pet owners, 15 said they own a dog, and 49 said they own a cat. 6 said they own both a dog and a cat. How many owned a cat but not a dog?
11. In a survey of 121 pet owners, 55 said they own a dog, and 84 said they own a cat. 47 said they own both a dog and a cat. How many owned a dog but not a cat?
12. In a survey of 112 pet owners, 77 said they own a dog, and 33 said they own a cat. 20 said they own both a dog and a cat. How many owned neither a cat nor a dog?
13. The following Venn diagram shows students in various college courses.
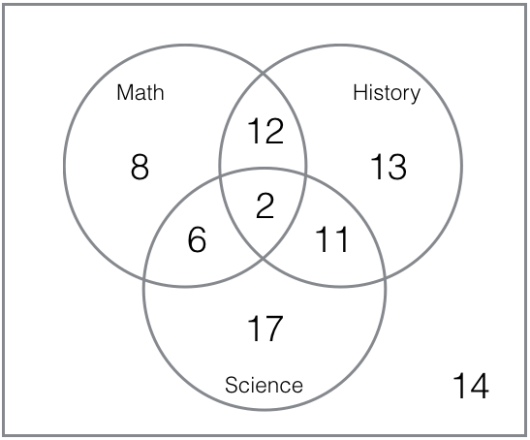
Determine the following:
a. How many students are taking Math?
b. How many students are taking Math and Science?
c. How many students are taking History and Science, but not Math?
d. How many students are taking exactly two of these classes?
14. The following Venn diagram shows cars in a parking lot.
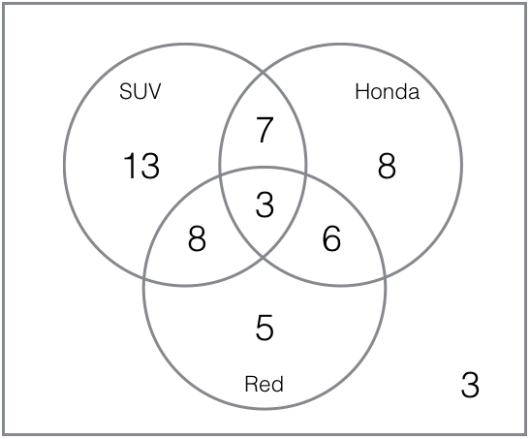
Determine the following
a. How many Hondas are in the parking lot?
b. How many red SUVs are in the parking lot?
c. How many of the Red cars in the parking lot are not Hondas?
15. The following Venn diagram shows people at a party.
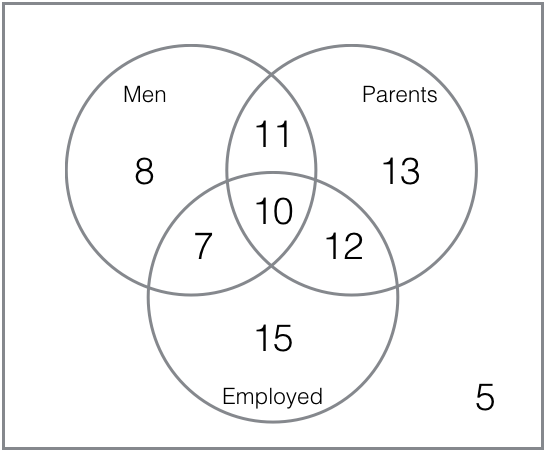
Determine the following:
a. How many people at the party are employed?
b. How many people at the party are mothers?
c. How many people at the party are working fathers?
d. How many people at the party are not parents?
16. A survey was given to students asking whether they watch movies at home from Netflix, Hulu, or Amazon Prime. The results are below.
52 only use Netflix
62 only use Hulu
24 only use Amazon Prime
16 use only Amazon Prime and Hulu
48 use only Netflix and Hulu
30 use only Amazon Prime and Netflix
10 use all three
25 use none of these
a. Use the data to complete a Venn diagram.
b. How many students use Hulu?
c. How many students use Hulu and Netflix?
d. How many students use Hulu or Netflix?
17. A survey asked buyers whether color, size, or brand influenced their choice of cell phone. The results are below.
169 said color
183 said size
213 said brand
122 said color and size
144 said color and brand
155 said size and brand
102 said all three
20 said none of these
a. Use the data to complete a Venn diagram.
b. How many buyers were influenced by only brand?
c. How many buyers were influenced by only color and size?
d. How many buyers were influenced by color or size?
18. A survey asked people what alternative transportation modes they use. The results are below.
30% use the bus
20% ride a bicycle
25% walk
5% use the bus and ride a bicycle
10% ride a bicycle and walk
12% use the bus and walk
2% use all three
a. Use the data to complete a Venn diagram.
b. What percent of people only ride the bus?
c. What percent of people don’t use any of these alternative transportation options?
d. What percent of people walk or ride a bicycle?
