
Section S.3 – Practice Problems
1. The histogram below shows the “Exam Scores” for a sample of 28 students.
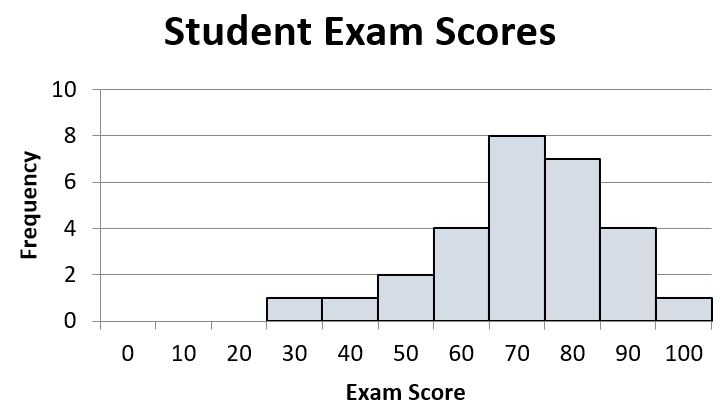
a. Is the distribution symmetric or skewed?
b. Classify the shape of the distribution as bell shaped, uniform, right-skewed, or left-skewed.
c. Do there appear to be any outliers in the data set? Why or why not?
2. The histogram below shows the “Exam Scores” for a sample of 28 students.
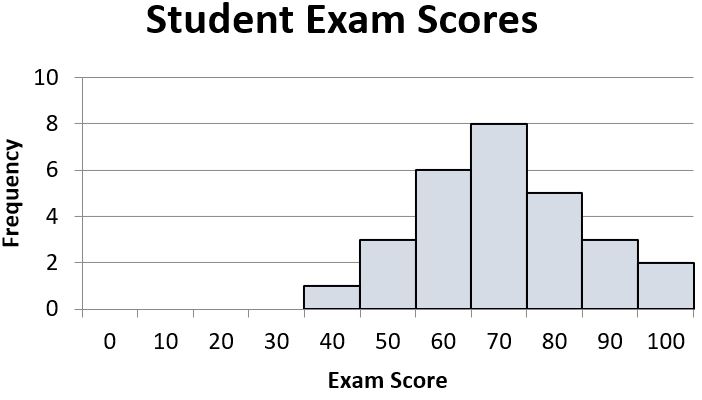
a. Is the distribution symmetric or skewed?
b. Classify the shape of the distribution as bell shaped, uniform, right-skewed, or left-skewed.
c. Do there appear to be any outliers in the data set? Why or why not?
3. The histogram below shows the “Exam Scores” for a sample of 28 students.
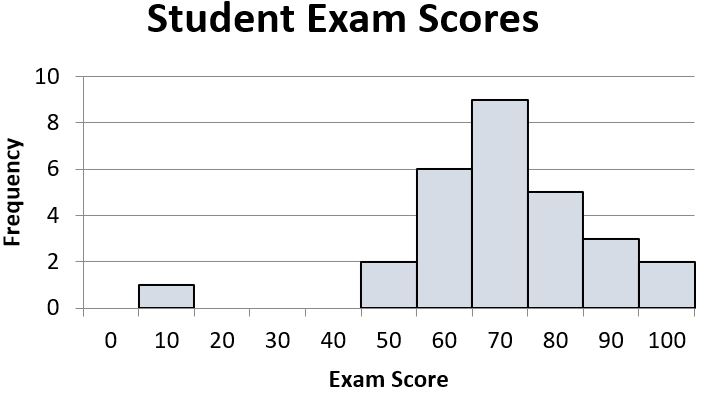
a. Is the distribution symmetric or skewed?
b. Classify the shape of the distribution as bell shaped, uniform, right-skewed, or left-skewed.
c. Do there appear to be any outliers in the data set? Why or why not?
4. A student started an online T-shirt business. The histogram below shows the “Number of T-Shirts Sold” over a period of 52 weeks.
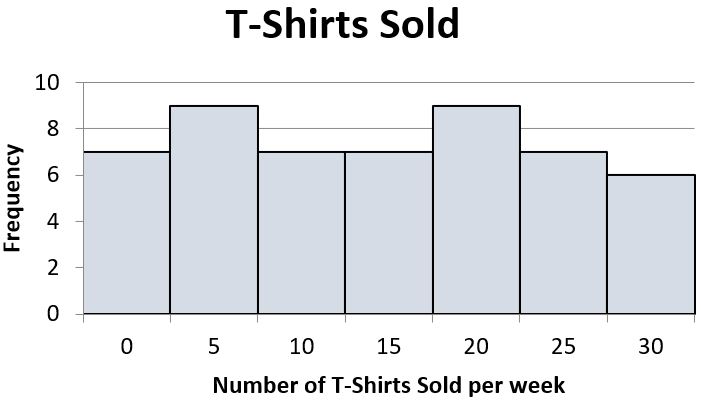
a. Is the distribution symmetric or skewed?
b. Classify the shape of the distribution as bell shaped, uniform, right-skewed, or left-skewed.
c. Do there appear to be any outliers in the data set? Why or why not?
5. A survey was administered at a gym asking people how many hours they spend exercising in one week. The histogram below shows the “Number of Hours Exercising” for a sample of 15 people.
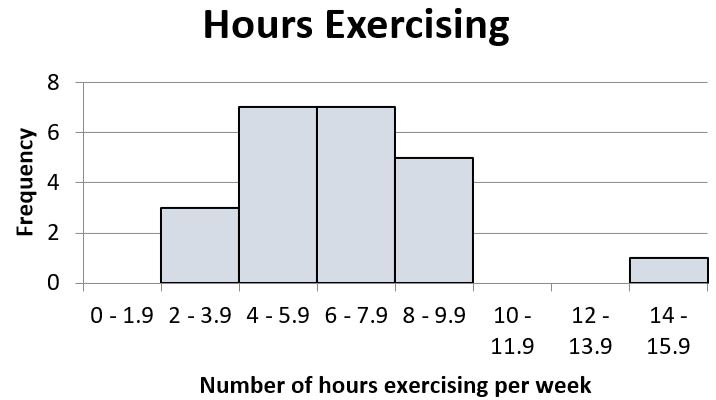
a. Is the distribution symmetric or skewed?
b. Classify the shape of the distribution as bell shaped, uniform, right-skewed, or left-skewed.
c. Do there appear to be any outliers in the data set? Why or why not?
6. A group of diners were asked how much they would pay for a meal. Their responses were: $7.50, $8.25, $9.00, $8.00, $7.25, $7.50, $8.00, $7.00.
a. Find the mean.
b. Find the median.
c. Find the mode.
7. You recorded the time in seconds it took for 8 participants to solve a puzzle. The times were: 15.2, 18.8, 19.3, 19.7, 20.2, 21.8, 22.1, 29.4.
a. Find the mean.
b. Find the median.
c. Find the mode.
8. Five real estate exam scores are 430, 430, 480, 480, and 495. Find the mode(s).
9. Refer back to the type of pet(s) owned by a sample of individuals:
Dog Dog Dog Cat Bird Cat Turtle Dog Cat Cat Bird Hamster Fish Bird Dog Dog Cat Turtle Hamster Dog Cat Dog Dog Bird
a. What is the mode for type of pet(s) owned?
b. Why is the mode the best measure of center for this data set?
10. Refer to the histogram:
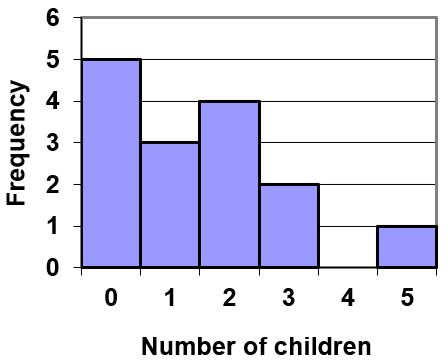
a. What is the mode of the number of children for the group surveyed?
b. Compute the mean number of children for the group surveyed.
c. Compute the median number of children for the group surveyed.
11. Refer to the histogram:
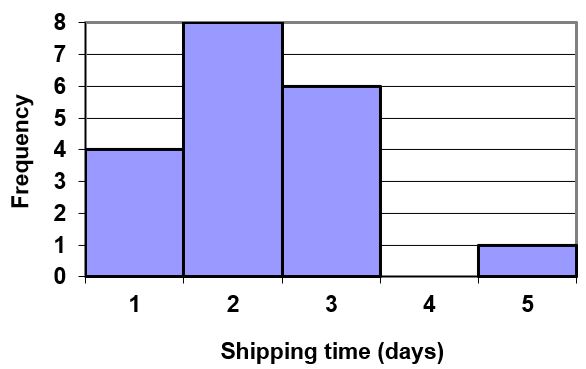
a. What is the mode of the number of shipping days?
b. Compute the mean number of shipping days.
c. Compute the median number of shipping days.
12. Suppose that in a small town of 50 people, one person earns $5,000,000 per year and the other 49 each earn $30,000. Calculate both the mean and the median. Which is the better measure of the “center”: the mean or the median?
13. Find the mean, median, and mode for the following data set.
14. Find the mean, median, and mode for the following data set.
Net Worth for Past U.S. Presidents
| President | Net Worth (millions of current dollars) |
| Obama, Barrack | $40 |
| Bush, George W. | $39.5 |
| Clinton, William | $75.9 |
| Bush, George H. | $26.3 |
| Reagan, Ronald | $14.3 |
| Carter, James | $8.1 |
| Ford, Gerald | $8.1 |
| Nixon, Richard | $17.2 |
| Johnson, Lyndon | $109.3 |
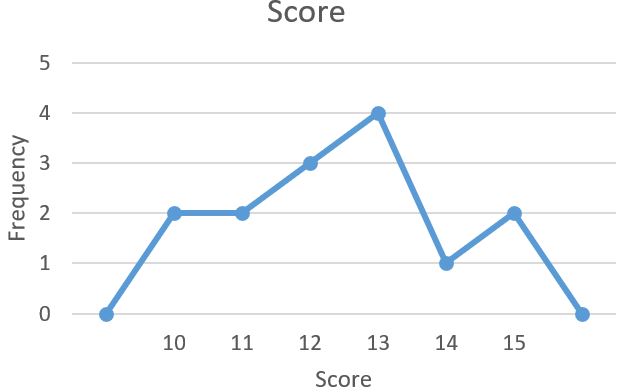
15. Find the mean, median, and mode for the frequency polygon.
16. Find the mean, median, and mode for the weights (in grams) of randomly selected M&M plain candies:
0.957 0.912 0.842 0.925 0.939 0.886 0.914 0.913 0.958 0.947 0.920
17. A graduate student in social work surveyed students at 10 colleges in a Midwestern state to find how many are single parents. The results are the data below:
700 298 638 260 1,380 280 270 1,350 380 570
Find the mean, median, and mode.
18. The number of miles run per week for 40 runners is given in the following frequency table. Find the mean, median, and mode.
| Miles per Week | 1 | 2 | 3 | 4 | 5 | 6 | 7 |
| Frequency | 12 | 2 | 1 | 3 | 9 | 1 | 12 |
19. Find the mean, median, and mode for the frequency distribution
| Results of Die Roll | 1 | 2 | 3 | 4 | 5 | 6 |
| Frequency | 4 | 1 | 5 | 1 | 2 | 7 |
20. State TRUE or FALSE for each statement. In a typical set of numerical data:
a. the mean is always one of the data values.
b. the median is always one of the data values.
c. the mode, if it exists, is always one of the data values.
