
Module PC: Probability and Counting
Chapter PC Learning Objectives:
- Distinguish between subjective, experimental, and theoretical probabilities
- Be familiar with probability terminology and properties of probabilities
- Use the complement formula to find probabilities
- Be able to calculate odds for and/or against an event
- Create tables to calculate expected values for real world applications including insurance and product warranties
- Be able to calculate “and”/ “or” probabilities
- Determine if two or more events are independent
- Determine if two or more events are mutually exclusive
- Use tables and tree diagrams to model possible outcomes in counting problems
- Use permutations and combinations for counting
- Be able to find probabilities using permutations and combinations
Section PC.1 – Types of Probability and Basic Concepts
Section PC.2 – Complementary Events; Calculating Odds
Section PC.3 – Expected Value
Section PC.4 – Independent Events; Conditional Probability
Section PC.5 – “Or” Probabilities
Section PC.6 – Basic Counting and Permutations
Section PC.7 – Combinations
Section PC.8 – Probability with Permutations and Combinations
Section PC.1 – Types of Probability
The probability of a specified event is the chance or likelihood that it will occur. There are several ways of viewing probability. One would be subjective in nature, in other words an educated guess. If someone asked you the probability that the Seattle Mariners would win their next baseball game, it would be impossible to conduct an experiment where the same two teams played each other repeatedly, each time with the same starting lineup and starting pitchers, each starting at the same time of day on the same field under the precisely the same conditions. Since there are so many variables to take into account, someone familiar with baseball and with the two teams involved might make an educated guess that there is a 75% chance they will win the game; that is, if the same two teams were to play each other repeatedly under identical conditions, the Mariners would win about three out of every four games. But this is just a guess, with no way to verify its accuracy, and depending upon how educated the educated guesser is, a subjective probability may not be worth very much. Let’s consider two other types of probabilities.
Another view of probability would be experimental in nature, where we repeatedly conduct an experiment. Suppose we flipped a coin over and over and over again and it came up heads about half of the time; we would expect that in the future whenever we flipped the coin it would turn up heads about half of the time. When a weather reporter says “there is a 10% chance of rain tomorrow,” she is basing that on prior evidence; that out of all days with similar weather patterns, it has rained on 1 out of 10 of those days.
We will return to the subjective and experimental probabilities from time to time, but in this course we will mostly be concerned with theoretical probability, which is defined as follows:
| Theoretical Probability |
|
Suppose there is a situation with n equally likely possible outcomes and that m of those n outcomes correspond to a particular event; then the probability of that event is defined as [latex]\frac{m}{n}[/latex]. Probability of an event = [latex]\frac{number~of~ways~the~event~can~occur}{total~number~of~possible~outcomes}[/latex] |
Let’s return to the coin flipping example. Instead of calculating the probability of the coin landing on heads by flipping a coin many times and observing the number of heads (which is an experimental probability) we could instead use what we know about coins. A fair coin has 2 equally likely possible outcomes: heads or tails. If we are interested in calculating the theoretical probability of a coin landing on heads, we could do so using the formula above:
[latex]\frac{number~of~ways~the~event~can~occur}{total~number~of~possible~outcomes}[/latex] = [latex]\frac{1}{2}[/latex]
Basic Concepts
If you roll a die, pick a card from deck of playing cards, or randomly select a person and observe their hair color, we are executing an experiment or procedure. In probability, we look at the likelihood of different outcomes. We begin with some terminology.
| Events and Outcomes |
|
The result of an experiment is called an outcome. An event is any particular outcome or group of outcomes. A simple event is an event that cannot be broken down further. The sample space is the set of all possible outcomes. |
| Example 1 |
| If we roll a standard 6-sided die, describe the sample space and some simple events. |
| The sample space is the set of all possible outcomes: {1,2,3,4,5,6}
Some examples of simple events: We roll a 1 Some of the events: We roll a number bigger than 4
|
| Basic Probability |
|
Given that all outcomes are equally likely, we can compute the probability of an event E using this formula: P (E ) = [latex]\frac{Number~of~outcomes~corresponding~to~the~event~E}{Total~number~of~equally~likely~outcomes}[/latex] |
| Example 2 |
| If we roll a 6-sided die, calculate:
a. P(rolling a 1) b. P(rolling a number bigger than 4) |
| Recall that the sample space is {1,2,3,4,5,6}
a. There is one outcome corresponding to “rolling a 1”, so the probability is [latex]\frac{1}{6}[/latex] b. There are two outcomes bigger than a 4, so the probability is [latex]\frac{2}{6}[/latex] = [latex]\frac{1}{3}[/latex] |
| You Try PC.1.A |
| If we roll a 6-sided die, calculate P(rolling an odd number). |
Probabilities are essentially fractions, and can be reduced to lower terms like fractions.
| Example 3 |
| Let's say you have a bag with 20 cherries, 14 sweet and 6 sour. If you pick a cherry at random, what is the probability that it will be sweet? |
| There are 20 possible cherries that could be picked, so the number of possible outcomes is 20. Of these 20 possible outcomes, 14 are favorable (sweet), so the probability that the cherry will be sweet is [latex]\frac{14}{20}[/latex] = [latex]\frac{7}{10}[/latex] |
There is one potential complication to this example, however. It must be assumed that the probability of picking any of the cherries is the same as the probability of picking any other. This wouldn't be true if (let us imagine) the sweet cherries are smaller than the sour ones. (The sour cherries would come to hand more readily when you sampled from the bag.) Let us keep in mind, therefore, that when we assess probabilities in terms of the ratio of favorable to all potential cases, we rely heavily on the assumption of equal probability for all outcomes.
| You Try PC.2.B |
| At some random moment, you look at your clock and note the minutes reading.
a. What is probability the minutes reading is 15? b. What is the probability the minutes reading is 15 or less? |
| Cards |
A standard deck of 52 playing cards consists of four suits (hearts, spades, diamonds and clubs). Spades and clubs are black while hearts and diamonds are red. Each suit contains 13 cards, each of a different rank: an Ace (which in many games functions as both a low card and a high card), cards numbered 2 through 10, a Jack, a Queen and a King. The Jack, Queen, and King are called face cards.
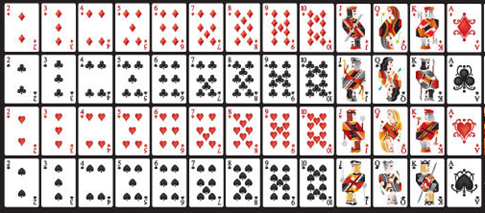
http://vector4free.com/vector/free-vector-playing-cards-deck/
| Example 4 |
| Compute the probability of randomly drawing one card from a deck and getting an Ace. |
| There are 52 cards in the deck and 4 Aces so P (Ace) = [latex]\frac{4}{52}[/latex] = [latex]\frac{1}{13}[/latex] ≈ 0.0769
We can also think of probabilities as percentages: There is a 7.69% chance that a randomly selected card will be an Ace. |
Notice that the smallest possible probability is 0 (there are no outcomes that correspond with the event). The largest possible probability is 1 (all possible outcomes correspond with the event).
| Certain and Impossible Events |
|
An impossible event has a probability of 0. A certain event has a probability of 1. The probability of any event must be 0 ≤ P ( E ) ≤ 1 |
In the course of this chapter, if you compute a probability and get an answer that is negative or greater than 1, you have made a mistake and should check your work.
| Example 5 |
| Find the probability of drawing a single card from a deck and getting a red spade. |
| There are 52 cards in the deck, but all spades are black. It is impossible to draw a single card and have that card be a red spade. This is an impossible event, so
P (red spade) = [latex]\frac{0}{52}[/latex] = 0 |
| Example 6 |
| You wake up on a cloudy, drizzly Seattle day to the weatherman saying the chance of rain today is 100%. Find the probability that it will rain today. |
| Since we are told the chance of rain is 100%, we know that this is a certain event.
P (rain) = [latex]\frac{100}{100}[/latex] = 1 |
| You Try PC.2.C |
| Your neighbor tells you that he heard on the radio that the probability of an earthquake of magnitude 7.0 or higher hitting California in the next 10 years is 1.2. How do you know that this is incorrect? |
Section PC.1 Answers to You Try Problems
PC.1.A
P(rolling an odd) = [latex]\frac{3}{6}[/latex] = [latex]\frac{1}{2}[/latex]
PC.2.B
a. [latex]\frac{1}{60}[/latex]
b. [latex]\frac{16}{60}[/latex]
PC.2.C
Probabilities must be between 0 and 1, so a probability of 1.2 is impossible.
