
Section S.2 – Practice Problems
1. In a study, you ask the subjects their age in years. Is this data qualitative or quantitative?
2. In a study, you ask the subjects their gender. Is this data qualitative or quantitative?
3. In a study, you determine the account number for a sample of customers. Is this data qualitative or quantitative?
4. In a study, you count the number of eggs laid by each chicken for a sample of chickens. Is this data qualitative or quantitative?
5. In a study, you measure the head circumference for a sample of 2-year-old children. Is this data qualitative or quantitative?
6. In a study, you record the gas mileage for a sample of vehicles. Is this data qualitative or quantitative?
7. For the following exercises, identify the type of data that would be used to describe a response (quantitative or qualitative), and give an example of the data.
a. number of tickets sold to a concert
b. percent of body fat
c. favorite baseball team
d. time in line to buy groceries
e. number of students enrolled at Scottsdale Community College
f. most-watched television show
g. brand of toothpaste
h. distance to the closest movie theatre
i. age of executives in Fortune 500 companies
j. number of competing computer spreadsheet software packages
8. The data below shows the favorite sport for a sample of 20 college freshmen.
| Football | Soccer | Baseball | Cheerleading | Basketball | Swimming |
| 5 | 4 | 4 | 2 | 4 | 1 |
a. Given the frequencies above, draw a relative-frequency table for the data.
b. Construct a bar graph of the data.
c. Construct a Pareto Chart of the data.
d. Draw a pie chart of the data.
9. The data below shows the type of pet(s) owned by a sample of individuals.
Dog Dog Dog Cat Bird Cat Turtle Dog Cat Cat Bird Hamster Fish Bird Dog
Dog Cat Turtle Hamster Dog Cat Dog Dog Bird
a. Construct a relative-frequency table for the type of pet.
b. Construct a bar graph of the data.
c. Construct a pie chart of the data.
10. The number of clear days in a year for several U.S. cities are provided in the table below. Construct a bar graph of the data.
|
City |
Clear Days |
|
Phoenix, Arizona |
211 |
|
Denver, Colorado |
115 |
|
Nashville, Tennessee |
102 |
|
Tampa, Florida |
101 |
|
Washington, DC |
96 |
|
Chicago, Illinois |
84 |
|
Cleveland, Ohio |
66 |
|
Rochester, New York |
61 |
|
Seattle, Washington |
58 |
|
|
n = 894 |
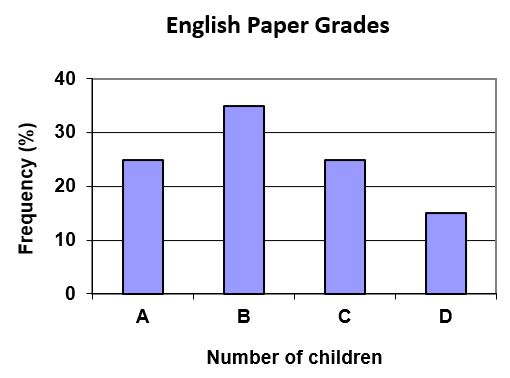
11. The bar graph below shows the percentage of students who received each letter grade on their last English paper. The class contains 20 students. What number of students earned an A on their paper?
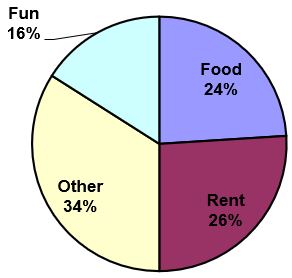
12. Kori categorized her spending for this month into four categories: Rent, Food, Fun, and Other. The percentages she spent in each category are pictured here. If she spent a total of $2600 this month, how much did she spend on rent?
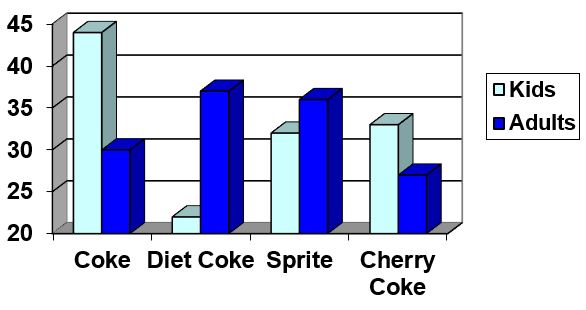
13. A graph appears below showing the number of adults and children who prefer each type of soda. There were 130 adults and kids surveyed. Discuss some ways in which the graph below could be improved.
14. The table below shows scores on a Math test.
| 80 | 50 | 50 | 90 | 70 | 70 | 100 | 60 | 70 | 80 | 70 | 50 |
| 90 | 100 | 80 | 70 | 30 | 80 | 80 | 70 | 100 | 60 | 60 | 50 |
a. Create a frequency table for the Math test scores.
b. Construct a histogram of the data.
15. A group of adults were asked how many cars they had in their household.
| 1 | 4 | 2 | 2 | 1 | 2 | 3 | 3 | 1 | 4 | 2 | 2 |
| 1 | 2 | 1 | 3 | 2 | 2 | 1 | 2 | 1 | 1 | 1 | 2 |
a. Create a relative-frequency table for the car number data.
b. Construct a histogram of the data.
16. A group of adults were asked how many children they have in their families. The graph below shows the number of adults who indicated each number of children.
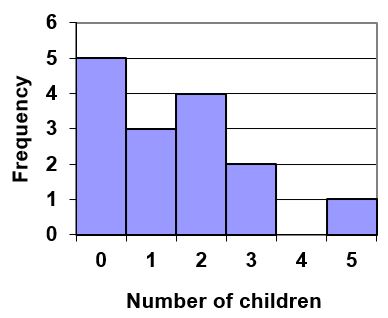
a. How many adults where questioned?
b. What percentage of the adults questioned had 0 children?
17. Jasmine was interested in how many days it would take an order from Amazon to arrive at her door. The graph below shows the data she collected.
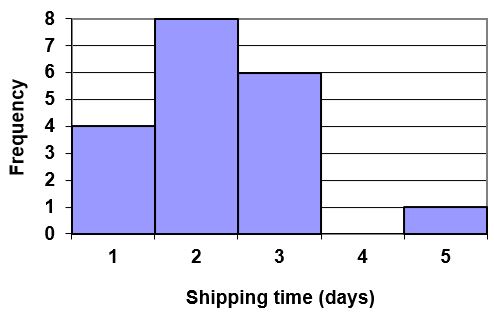
a. How many orders did she make?
b. What percentage of the orders arrived in one day?
