
Section S.2 – Solutions to the Practice Problems
1. quantitative
2. qualitative
3. qualitative
4. quantitative
5. quantitative
6. quantitative
7.
a. quantitative
b. quantitative
c. qualitative
d. quantitative
e. quantitative
f. qualitative
g. qualitative
h. quantitative
i. quantitative
j. quantitative
8.
a.
| Sport |
Frequency |
Relative Frequency |
| Football |
5 |
0.25 |
| Soccer |
4 |
0.2 |
| Baseball |
4 |
0.2 |
| Cheerleading |
2 |
0.1 |
| Basketball |
4 |
0.2 |
| Swimming |
1 |
0.05 |
|
Total |
20 |
1 |
b. 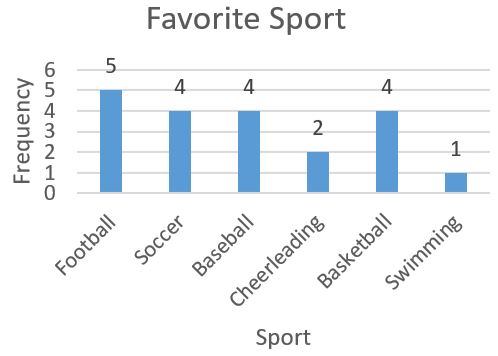
c. 
d. 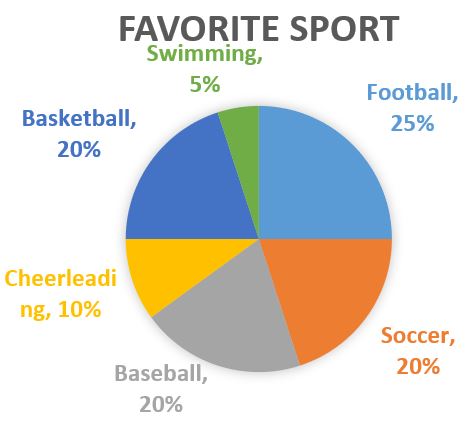
9.
a.
| Type of Pet |
Frequency |
Relative Frequency |
| Dog |
9 |
0.375 |
| Cat |
6 |
0.250 |
| Bird |
4 |
0.167 |
| Turtle |
2 |
0.083 |
| Hamster |
2 |
0.083 |
| Fish |
1 |
0.042 |
|
Total |
24 |
1.000 |
b. 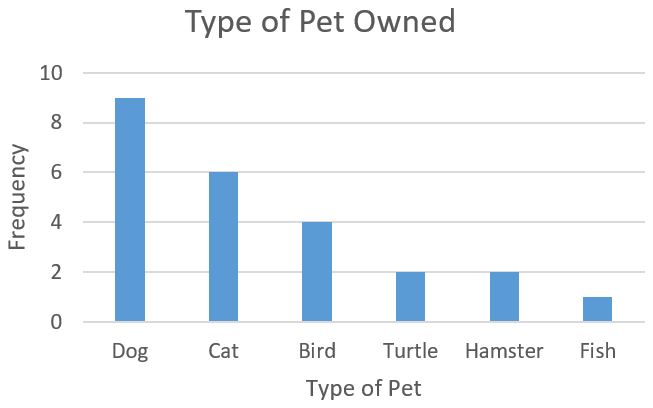
c.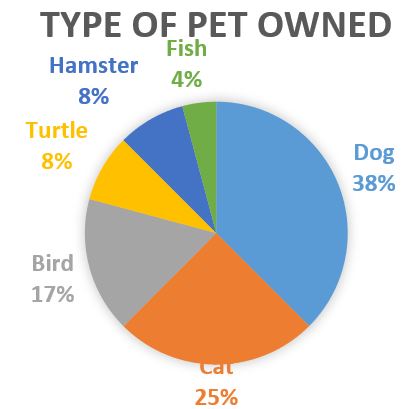
10. 
11. 0.25(20) = 5
12. 0.26($2600) = $676
13. The graph needs a title, the axes need to be labeled (including units), the 3D makes the graph difficult to read.
14.
a.
|
Test Score |
Frequency |
|
30 |
1 |
|
40 |
0 |
|
50 |
4 |
|
60 |
3 |
|
70 |
6 |
|
80 |
5 |
|
90 |
2 |
|
100 |
3 |
|
|
n = 24 |
b. 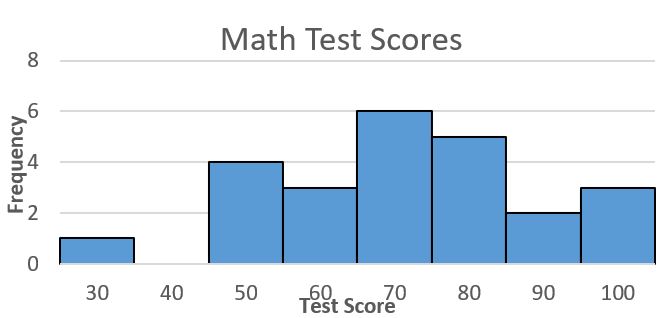
15.
|
Number of Cars |
Frequency |
Relative-Frequency |
|
1 |
9 |
0.375 |
|
2 |
10 |
0.417 |
|
3 |
3 |
0.125 |
|
4 |
2 |
0.083 |
|
|
n = 24 |
1.000 |
b. 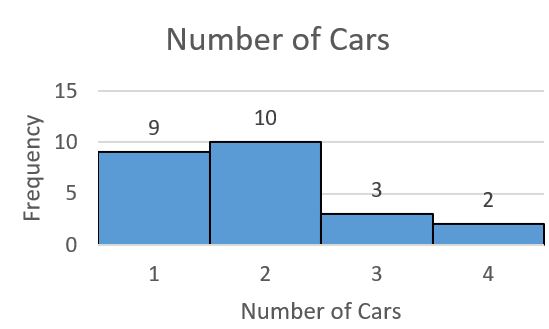
16.
a. 15 people
b. 33.33%
17.
a. 19 orders
b. about 21%
