
Section S.4 - Practice Problems
1. A group of diners were asked how much they would pay for a meal. Their responses were: $7.50, $8.25, $9.00, $8.00, $7.25, $7.50, $8.00, $7.00.
a. Find the range.
b. Find the mean
c. Find the standard deviation.
2. You recorded the time in seconds it took for 8 participants to solve a puzzle. The times were: 15.2, 18.8, 19.3, 19.7, 20.2, 21.8, 22.1, 29.4.
a. Find the range.
b. Find the mean
c. Find the standard deviation.
3. The following table provides the tuition rates (in $ per credit hour) at a sample of 15 colleges and universities.
|
175 |
416 |
87 |
203 |
180 |
|
257 |
182 |
111 |
315 |
504 |
|
163 |
218 |
744 |
221 |
1300 |
a. Find the mean tuition rate.
b. Find the standard deviation of the tuition rate.
4. A survey of enrollment at 35 community colleges across the United States yielded the following figures:
6414; 1550; 2109; 9350; 21828; 4300; 5944; 5722; 2825; 2044; 5481; 5200; 5853; 2750; 10012; 6357; 27000; 9414; 7681; 3200; 17500; 9200; 7380; 18314; 6557; 13713; 17768; 7493; 2771; 2861; 1263; 7285; 28165; 5080; 11622
a. Organize the data into a chart with five intervals of equal width. Label the two columns "Enrollment" and "Frequency."
b. Construct a histogram of the data.
c. Calculate the sample mean.
d. Calculate the sample standard deviation.
5. On a baseball team, the ages of each of the players are as follows:
21; 21; 22; 23; 24; 24; 25; 25; 28; 29; 29; 31; 32; 33; 33; 34; 35; 36; 36; 36; 36; 38; 38; 38; 40
a. Organize the data into a chart with five intervals of equal width. Label the two columns "Age" and "Frequency."
b. Construct a histogram of the data.
c. Calculate the sample mean.
d. Calculate the sample standard deviation.
6. Twenty-five randomly selected students were asked the number of movies they watched the previous week. The results are as follows:
|
# of movies |
Frequency |
|
0 |
5 |
|
1 |
9 |
|
2 |
6 |
|
3 |
4 |
|
4 |
1 |
|
|
n = 25 |
a. Find the sample mean.
b. Find the standard deviation.
c. Find the 5 Number Summary.
d. Draw the boxplot.
7. Forty randomly selected students were asked the number of pairs of sneakers they owned. Let X = the number of pairs of sneakers owned. The results are as follows:
|
# of pairs |
Frequency |
|
1 |
2 |
|
2 |
5 |
|
3 |
8 |
|
4 |
12 |
|
5 |
12 |
|
6 |
0 |
|
7 |
1 |
|
|
n = 40 |
a. Find the 5 Number Summary for the data set.
b. Draw the boxplot for the data set.
8. The following table provides the tuition rates (in $ per credit hour) at a sample of 15 colleges and universities.
|
175 |
416 |
87 |
203 |
180 |
|
257 |
182 |
111 |
315 |
504 |
|
163 |
218 |
744 |
221 |
1300 |
a. Find the 5 Number Summary for the data set.
b. Draw the boxplot for the data set.
c. Find the 25th percentile for the data set.
d. Find the 50th percentile for the data set.
9. Following are the published weights (in pounds) of all of the team members of the San Francisco 49ers from a previous year.
177; 205; 210; 210; 232; 205; 185; 185; 178; 210; 206; 212; 184; 174; 185; 242; 188; 212; 215; 247; 241; 223; 220; 260; 245; 259; 278; 270; 280; 295; 275; 285; 290; 272; 273; 280; 285; 286; 200; 215; 185; 230; 250; 241; 190; 260; 250; 302; 265; 290; 276; 228; 265
a. Find the mean of the data.
b. Find the standard deviation of the data.
c. Find the 5 Number Summary
d. Construct a box plot of the data.
10. Sixty-five randomly selected car salespersons were asked the number of cars they generally sell in one week. Fourteen people answered that they generally sell three cars; nineteen generally sell four cars; twelve generally sell five cars; nine generally sell six cars; eleven generally sell seven cars.
a. Find the 5 Number Summary for this data set.
b. Construct a box plot for this data set.
c. Find the 50th percentile for the data set.
d. Find the 75th percentile for the data set.
11. The box plot below shows salaries for Actuaries and CPAs.
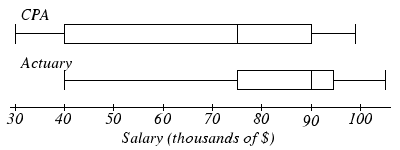
a. What is the 5 Number Summary for CPA’s?
b. What is the 5 Number Summary for Actuaries?
c. Kendra makes the median salary for an Actuary. Kelsey makes the first quartile salary for a CPA. Who makes more money? How much more?
12. Referring to the boxplot above, what percentage of actuaries make more than the median salary of a CPA?
13. A survey was conducted of 130 purchasers of new BMW 3 series cars, 130 purchasers of new BMW 5 series cars, and 130 purchasers of new BMW 7 series cars. In it, people were asked the age they were when they purchased their car. The following box plots display the results.
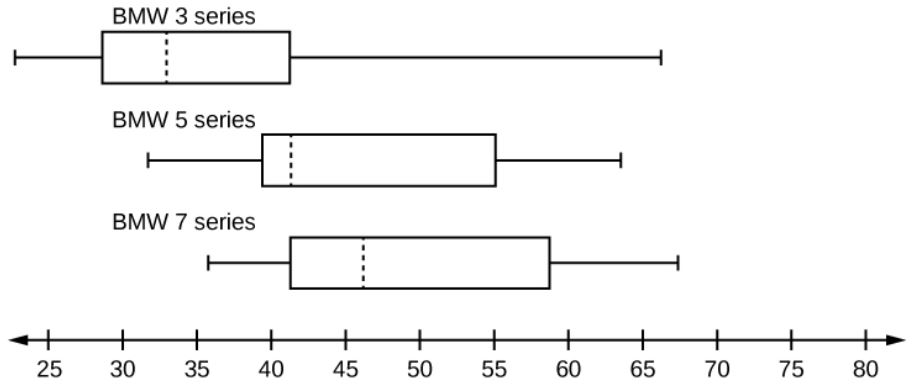
a. Which BMW series has the largest median?
b. Which BMW series has the largest standard deviation?
c. As the BMW series increases from 3 to 5 to 7, the price also increases. Does that surprise you, based on the data in the boxplots? Why or why not? Explain your reasoning.
14. Studies are often done by pharmaceutical companies to determine the effectiveness of a treatment program. Suppose that a new AIDS antibody drug is currently under study. It is given to patients once the AIDS symptoms have revealed themselves. Of interest is the average length of time in months patients live once they have started the treatment. Two researchers each follow a different set of 40 AIDS patients from the start of treatment until their deaths. The following data (in months) are collected.
Researcher 1: 3; 4; 11; 15; 16; 17; 22; 44; 37; 16; 14; 24; 25; 15; 26; 27; 33; 29; 35; 44; 13; 21; 22; 10; 12; 8; 40; 32; 26; 27; 31; 34; 29; 17; 8; 24; 18; 47; 33; 34
Researcher 2: 3; 14; 11; 5; 16; 17; 28; 41; 31; 18; 14; 14; 26; 25; 21; 22; 31; 2; 35; 44; 23; 21; 21; 16; 12; 18; 41; 22; 16; 25; 33; 34; 29; 13; 18; 24; 23; 42; 33; 29
a. Create comparative histograms of the data.
b. Create comparative boxplots of the data.
15. Complete the following statements.
a. In general, _________ % of the values in a data set lie at or below the median.
b. _________ % of the values in a data set lie at or below the first quartile (Q1).
c. If a sample consist of 2356 test scores, _________ of them would be at or below the second quartile (Q2).
d. If a sample consist of 2356 test scores, _________ of them would be at or below the third quartile (Q3).
16. Complete the following statements.
a. In general, _________ % of the values in a data set lie at or below the 15th percentile.
b. _________ % of the values in a data set lie at or above the 43nd percentile.
c. If a sample consist of 1520 test scores, _________ of them would be at or below the 55th percentile.
d. If a sample consist of 1520 test scores, _________ of them would be at or above the 15th percentile.
17. Complete the following statements.
a. The first quartile (Q1) corresponds to the _________th percentile.
b. The median corresponds to the _________th percentile.
c. The second quartile (Q2) corresponds to the _________th percentile
d. The third quartile (Q3) corresponds to the _________th percentile.
18. The data sets give the number of platinum albums for the five male artist s and the five female artists in the United States with the most platinum albums. (Platinum albums sell one million units or more.)
|
Artist |
Platinum Albums |
|
Garth Brooks |
145 |
|
Elvis Presley |
104 |
|
Billy Joel |
80 |
|
Michael Jackson |
71 |
|
Elton John |
65 |
|
Artist |
Platinum Albums |
|
Mariah Carey |
64 |
|
Madonna |
63 |
|
Barbra Streisand |
61 |
|
Whitney Houston |
54 |
|
Celine Dion |
48 |
a. Without calculating, which data set has the greater mean number of platinum albums? Explain your answer.
b. Verify your conjecture from part (a) by calculating the mean number of platinum albums for each data set.
c. Without calculating, which data set has the greater standard deviation? Explain your answer.
d. Verify your conjecture from part (c) by calculating the standard deviation for each data set. Round answers to two decimal places.
19. Some utility companies offer residents an equalizer plan, which is a payment plan that allows the customers to pay the same amount each month so they can budget their finances. Which customer would benefit more from the equalizer plan? Explain Why? The following information is the summary of each resident’s past payments.
The Arnold Family
Mean = $250
Standard Deviation = $75
The Barney Family
Mean = $250
Standard Deviation = $35
20. Who is the more consistent golfer?
Archie Bunker
Mean = 82
Standard Deviation = 8
Richard Mulligan
Mean = 82
Standard Deviation = 5
21. Given the following bar graph find:
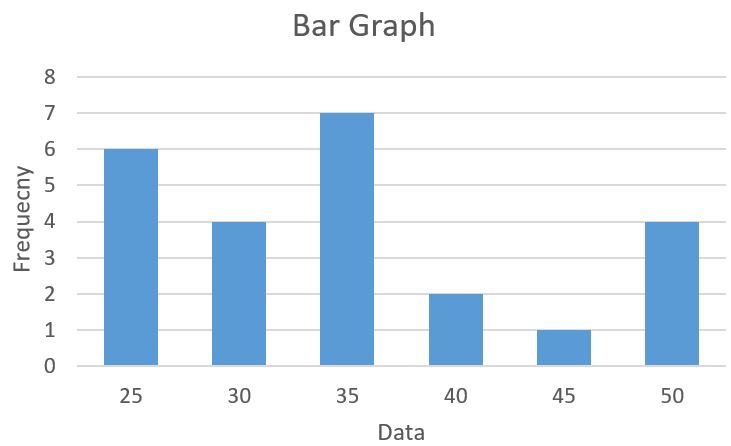
a. Range
b. Standard deviation. Round to two decimal places.
c. The 5 number summary
22. Given the following histogram find:
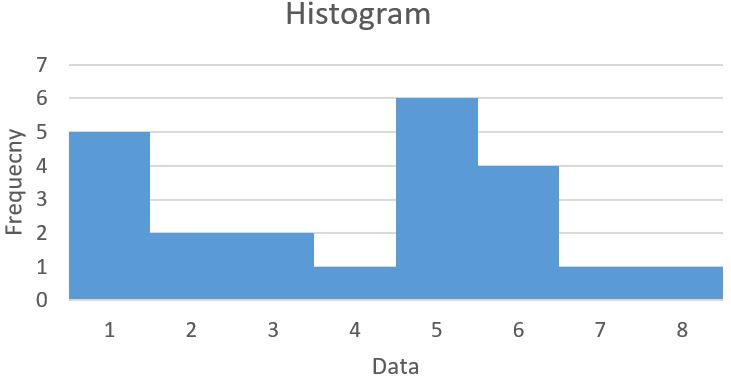
a. Range
b. Standard deviation. Round to two decimal places.
c. The 5 number summary
