
30 IR Spectrum and Characteristic Absorption Bands
Chapter 30 Learning Objectives
- Be able to distinguish the fingerprint and functional group regions in an IR spectrum.
- Be able to analyze an IR spectrum for important functional group bands.
With the basic understanding of the IR theory, we will take a look at the actual output from IR spectroscopy experiments, and learn how to get structural information from IR spectrum. Figure 30.1 shows the IR spectrum for 2-hexanone.

Figure 30.1 IR Spectrum of 2-hexanone
Notes for interpreting IR spectra:
- The vertical axis is ‘% transmittance’, which tells how strongly light was absorbed at each frequency. The solid line traces the values of % transmittance for every wavelength passed through the sample. At the high end of the axis, 100% transmittance means no absorption occurred at that frequency. Lower values of % transmittance mean that some of the energy is absorbed by the compound, and gives the downward spikes. The spikes are called absorption bands in an IR spectrum. A molecule have a variety of covalent bonds, and each bond have different vibration modes, so the IR spectrum of a compound usually show multiple absorption bands.
- The horizontal axis indicates the position of an absorption band. But instead of using frequency to show the absorbed radiation, wavenumbers (
 , in unit of cm-1) are used as a conventional way in IR spectra. The wavenumber is defined as the reciprocal of wavelength, and the wavenumbers of infrared radiation are normally in the range of 4000 cm-1 to 600 cm-1.
Please note the direction of the horizontal axis (wavenumber) in IR spectra decrease from left to right. The larger wavenumbers (shorter wavelengths) are associated with higher frequencies and higher energy.
Look at the IR spectra of hexane, 1-hexene, and 1-hexyne in Figures 30.2, 30.3 and 30.4 respectively to see an example of how IR spectroscopy can be used. Although all three IR spectra contain many peaks, there are characteristic absorptions of and functional groups that allow the three compounds to be distinguished. Thus, 1-hexene shows a characteristic absorption at 1660 cm–1 and a vinylic =C–H absorption at 3100 cm–1, whereas 1-hexyne has an absorption at 2100 cm–1 and a terminal alkyne absorption at 3300 cm–1.
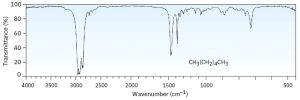
Figure 30.2 IR Spectrum of Hexane
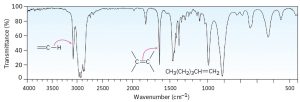
Figure 30.3 IR Spectrum of Hexene
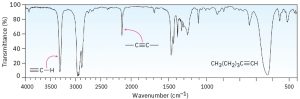
Figure 30.4 IR Spectrum of Hexyne
Stretching Vibrations
Generally, stretching vibrations the stretching vibrations require more energy and show absorption bands in the higher wavenumber/frequency region. The characteristics stretching vibration bands associated with the bonds in some common functional groups are summarized in Table 30.1.
| Formula |
Bond |
Characteristic IR Frequency range (cm-1) |
| alcohol |
O-H stretching |
3200 – 3600 (broad)
|
| carbonyl |
C=O stretching |
1650 – 1750 (strong)
|
| aldehyde |
C-H stretching |
~ 2800 and ~ 2700 (medium)
|
| carboxylic acid |
C=O stretching |
1700 – 1725 (strong)
|
|
O-H stretching |
2500 – 3300 (broad)
|
|
| alkene |
C=C stretching |
1620 – 1680 (weak)
|
|
vinyl =C-H stretching |
3020 – 3080
|
|
| benzene |
C=C stretching |
~ 1600 and 1500 – 1430
(strong to weak)
|
| alkyne |
C≡C stretching |
2100 – 2250 (weak)
|
|
terminal ≡C-H stretching |
3250 – 3350
|
|
| alkane |
C-H stretching |
2850-2950
|
| amine |
N-H stretching |
3300-3500 (medium)
|
Table 30.1 Characteristic IR Frequencies of Stretching Vibrations
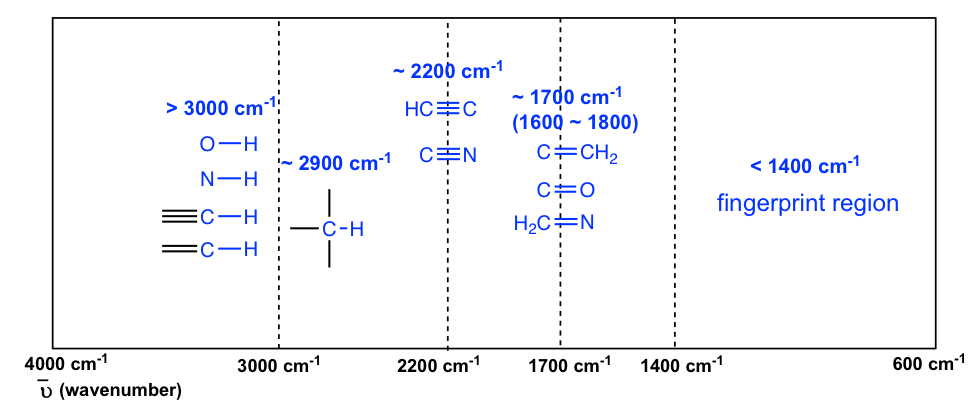
The information in Table 30.1 can be summarized in the Figure 30.2 that is easier to be identified, in which the IR spectrum is divided in several regions, with the characteristic band of certain groups labelled.
The absorption bands in IR spectra have different intensity, that can usually be referred to as strong (s), medium (m), weak (w), broad and sharp. The intensity of a absorption band depends on the polarity of the bond, the bond with higher polarity will show more intense absorption band. The intensity also depends on the number of bonds responsible for the absorption, the absorption band with more bonds involved has higher intensity.
- The region from 4000 to 2500 cm–1 corresponds to absorptions caused by N–H, C–H, and O–H single bond stretching motions.
- N–H and O–H bonds absorb in the 3300 to 3600 cm–1 range; C–H bond stretching occurs near 3000 cm–1.
- The region from 2500 to 2000 cm–1 is where triple-bond stretching occurs. Both and bonds absorb here.
- The region from 2000 to 1500 cm–1 is where double bonds absorb.
- Carbonyl groups generally absorb in the range 1680 to 1750 cm–1, and alkene stretching normally occurs in the narrow range of 1640 to 1680 cm–1.
- The region below 1500 cm–1 is the fingerprint portion of the IR spectrum. A large number of absorptions due to a variety of C–C, C–O, C–N, and C–X single-bond vibrations occur here.
- The polar O-H bond (in alcohol and carboxylic acid) usually shows strong and broad absorption bands that are easy to be identified. The broad shape of the absorption band results from the hydrogen bonding of the OH groups between molecules. The OH bond of alcohol group usually has absorption in the range of 3200-3600 cm-1, while the OH bond of carboxylic acid group occurs at about 2500-3300 cm-1.
- The polarity of N-H bond (in amine and amide) is weaker than OH bond, so the absorption band of N-H is not as intense, nor that broad as O-H, and the position is in 3300-3500 cm-1 region.
- The C-H bond stretching of all hydrocarbons occur in the range of 2800-3300 cm-1, and the exact location can be used to distinguish between alkane, alkene and alkyne. Specifically:
- ≡C-H (sp C-H) bond of terminal alkyne give absorption at about 3300 cm-1
- =C-H (sp2 C-H) bond of alkene give absorption at about 3000-3100 cm-1
- -C-H (sp3 C-H) bond of alkane give absorption at about ~2900 cm-1
- A special note should be taken for the C-H bond stretching of an aldehyde group that shows two absorption bands, one at ~2800 cm-1 and the other at ~ 2700 cm-1. It is therefore relative easy to identify the aldehyde group (together with the C=O stretching at about 1700 cm-1) since essentially no other absorptions occur at these wavenumbers.
- The stretching vibration of triple bonds C≡C and C≡N have absorption bands of about 2100~2200 cm-1. The band intensity are in medium to weak level. The alkynes can generally be identified with the characteristic weak but sharp IR absorbance bands in the range of 2100-2250 cm-1 due to stretching of the C≡C triple bond, and terminal alkynes can be identified by their absorbance at about 3300 cm-1, due to stretching of sp C-H.
- As mentioned earlier, the C=O stretching has strong absorption band in the 1650-1750 cm-1 region. Other double bonds like C=C and C=N have absorptions in bit lower frequency regions of about 1550-1650 cm-1. The C=C stretching of an alkene only shows one band at ~1600 cm-1 , while a benzene ring is indicated by two sharp absorption bands, one at ~1600 cm-1 and one at 1500-1430 cm-1
A region with the lower frequency 400-1400 cm-1 in the IR spectrum is called the fingerprint region. Kind of like a human fingerprint, the pattern of absorbance bands in the fingerprint region is characteristic of the compound as a whole. Even if two different molecules have the same functional groups, their IR spectra will not be identical and such difference will be reflected in the bands in the fingerprint region. Therefore the IR from an unknown sample can be compared to a database of IR spectra of known standards in order to confirm the identification of the unknown sample.
