
38 Application of Spectroscopy
The following article has been modified under a Creative Common license. The original article was published in The Conversation. The author of the article is PhD; Astronomer and Outreach Officer, Australian Astronomical Observatory.
A spectrum allows astronomers to determine many things about the object being viewed, such as how far away it is, its chemical makeup, age, formation history, temperature and more. While every astronomical object has a unique rainbow fingerprint, some general properties are universal.
Video (below) shows the path of distant starlight through the 4-metre Anglo-Australian Telescope (AAT) and a typical spectrograph, revealing real data at the end.
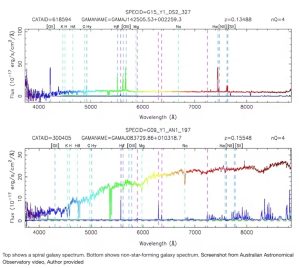
Figure 39.1 Galaxy Spectra
Examine the galaxy spectra shown in the video. The spectrum of a galaxy is the combined light from its billions of stars and all other radiating matter in the galaxy, such as gas and dust. In the top spectrum you can see a few strong spikes. These are called “emission lines” and occur at discrete wavelengths due to the atomic structure of atoms as electrons jump between energy levels. The hydrogen spectrum is particularly important because 90% of the normal matter in the universe is hydrogen. Because of the details of hydrogen’s atomic structure, we recognise the strong hydrogen-alpha emission line at roughly 7,500 Angstroms in the top spectrum image. In a galaxy, only the youngest, biggest stars are hot enough to excite surrounding hydrogen gas enough that the electrons populate the third energy level, before falling to the second lowest, thus emitting a hydrogen-alpha photon. Because of this, we know the strength of the hydrogen-alpha line in a galaxy’s spectrum indicates how many very young stars there are in the galaxy. Since the bottom spectrum shows no hydrogen-alpha emission, we can conclude that the bottom galaxy is not sparking new life in the form of shining stars, while the top galaxy harbours several hard working stellar nurseries. In the bottom spectrum you can see a number dips. These are called “absorption lines” because they appear in the spectrum if there is anything between the light’s source and the observer on Earth absorbing the light. Absorbing material could be the extended layers of a star or interstellar clouds of gas or dust. The absorption lines close to each other below 5,000 Angstroms in the bottom spectrum are the calcium H and K lines and can be used to determine how quickly stars are zooming around the galaxy. A basic piece of information derived from a spectrum is the distance to the galaxy, or specifically, how much the light has stretched during its journey to Earth. Because the universe is expanding, the light emitted by the galaxy is stretched toward redder wavelengths as it innocently moves across space. We measure this as redshift. To determine the exact distance of a galaxy, astronomers measure the well-studied pattern of absorption and emission lines in the observed spectrum and compare it to the laboratory wavelengths of these features on Earth. The difference tells how much the light was stretched, and therefore how long the light was travelling through space, and consequently how far away the galaxy is. In the top galaxy spectrum mentioned earlier, we measure the strong red emission line of hydrogen-alpha to be at a wavelength of roughly 7,450 Angstroms. Since we know that line has a rest wavelength of 6,563 Angstroms, we calculate a redshift of 0.13, which means the light was travelling for 1.7 billion years before it reached our lucky telescope. The galaxy emitted that light when the universe was roughly 11.8 billion years old.
