
3.1 – Mean
The mean, or average, is the most used and most useful measure of center. One of the advantages is that it takes every score into account. To calculate the mean, just add up all the scores in the group and then divide by the total number of scores in the group. Here is the formula:
Population Mean Formula
Let’s say we had the set of ten scores we discussed previously (4, 4, 4, 5, 5, 5, 5, 6, 6, 6). To calculate the mean, we would just add up all the scores (∑X):
[latex]\Sigma X = 4+4+4+4+5+5+5+5+6+6+6=50[/latex]
Then we divide that total by the total number of scores (N):
[latex]\text{Mean}=\mu= \frac{\Sigma X}{N}=\frac{50}{10}=5[/latex]
Thus, the average score for these 10 individuals was 5. As you can see from the calculation, the mean includes every score in its measurement. Thus, it is sensitive to every score.
Ways to Think About the Mean
While most people have calculated means or averages before, it can be helpful to understand what we get in the actual result. One way to think of the mean is as a measure of what score the entire group would have if everyone had the same amount of what you are measuring. For example, let’s say there was a group of ten people and I asked everyone in that group to give me all the money they have on them at that moment (some have a lot and some have little or none), which turns out to be $100 exactly. Then let’s say I return all $100 to the group, but I do it so that everyone has the exact same amount. To do this, I give everyone exactly $10 each. Well, that $10 is the mean.
Another way to think of the mean is as a balancing point. It is the value on the number line that balances how many people and how much they have. Let’s say we have a group of people with the following scores: 2, 2, 6, and 10. Think of each person as a block on a board that we will try to balance:
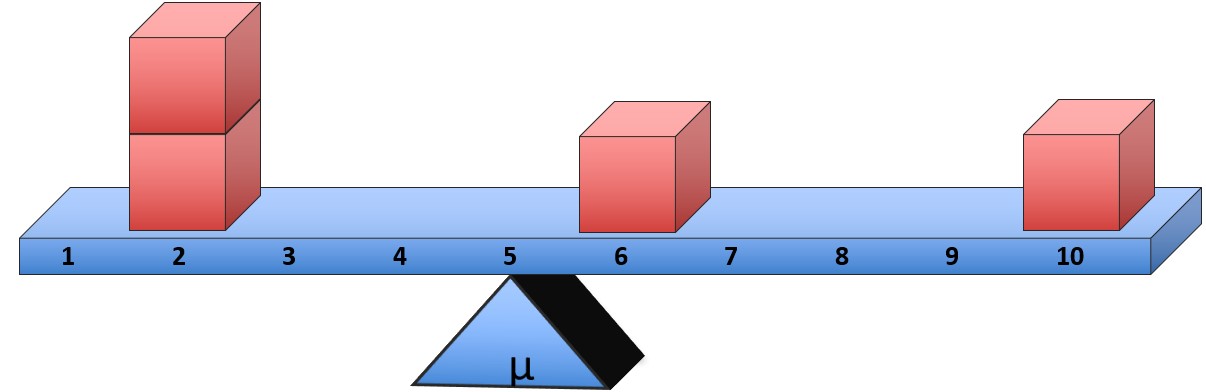
We can see that the board balances at 5, which also happens to be the mean:
[latex]\mu= \frac{\Sigma X}{N}=\frac{2+2+6+10}{4}=\frac{20}{4}=5[/latex]
As we said before, the mean takes every score into account. Thus, if we change just one of the scores, the mean will often have to change to accommodate it. Let’s say that instead of a 6, that individual had a 10:
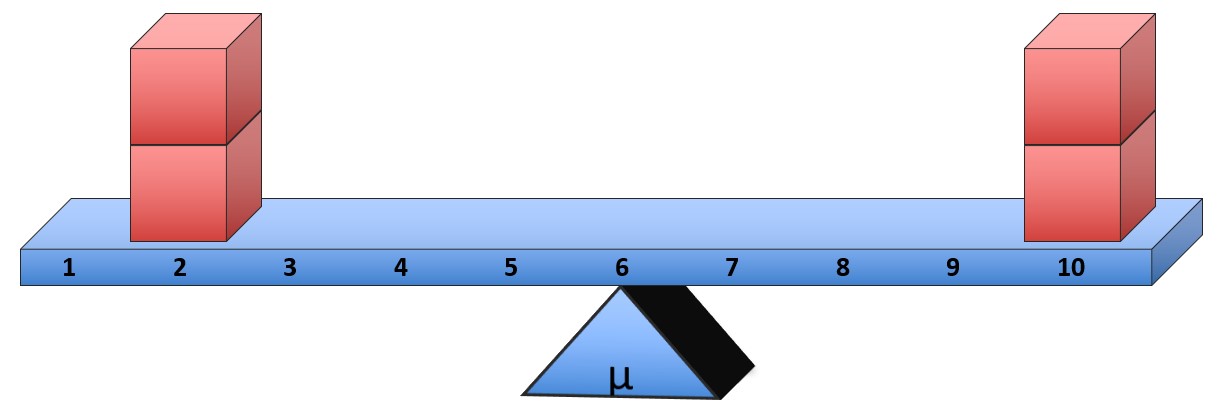
The balance point has to shift to a 6, which is now the mean:
[latex]\mu= \frac{\Sigma X}{N}=\frac{2+2+10+10}{4}=\frac{24}{4}=6[/latex]
With this balance example, the mean is taking into account how far each score is from the mean (which is called a deviation), and it makes sure that all the deviations add up to zero. Using the first balance example, you can see that the two scores of 2 are exactly 3 points below the mean, which result in deviations of -3. The score of 6 is 1 point above the mean, which results in a deviation of +1, and the score of 10 is 5 points two scores above the mean, which results in a deviation of +5.
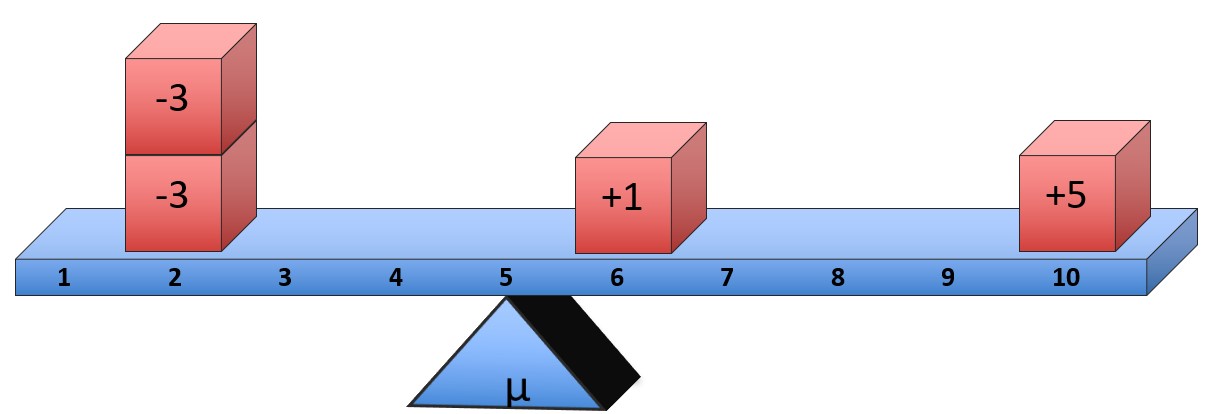
If you add up the deviations, they add up to zero:
[latex](-3) + (-3) + (+1) + (+5) = 0[/latex]
This sensitivity to every score is one of the advantages of the mean as a measure of center. However, it is also one of the disadvantages. Suppose, for example, that the score above of 10 was instead a 90. As we discovered, the mean will have to shift over to make sure that things balance, resulting in a mean of 25:
[latex]\mu= \frac{\Sigma X}{N}=\frac{2+2+6+90}{4}=\frac{1004}{4}=25[/latex]
While 25 is the perfect balancing point, it may not necessarily provide a great measure of center in explaining the “typical” or “average” score for the distribution because most of the scores are low scores (2, 2, and 6), but there is one extremely high score (90) that is having a big effect on the mean. These extreme scores are sometimes called outliers, and they can cause problems for various statistical measures. As a result, statisticians developed more measures of center.
Attributes of the Mean
When working with means, it can be helpful to know some of the following attributes. If you take every score in a distribution and
- add or subtract a constant, do the same with the mean
- multiply or divide by a constant, do the same with the mean
For example, if a group of scores has a mean of 25 and we then add 5 points to every score in the distribution, the mean will now be 30. Or if a group of scores has a mean of 100 and we then divide each score by 5, the mean will now be 20.

Feedback/Errata