
3.4 – Choosing a Measure of Center
Now that we know three measures of center, our next step is to understand which one to choose. In general, this is pretty simple because you should use the mean when you can. As we stated before, it is the most informative measure of center because it is calculated based upon all the scores in the distribution. It is also an important component of another very important measure, the standard deviation (which we will cover later in this chapter).
However, there are certain situations where the mean is not the best measure of center. In some situations, the mean is just not a good measure of the most “typical” score for the distribution. In other situations, it is simply just impossible to calculate.
Mean Is Not the Best Measure of the Group
As we noted before, the mean is sensitive to every score in the distribution. While this is part of what makes the mean generally the superior measure of center, it also makes it sensitive to abnormalities in a group of scores. As a result, the mean can be thrown off and not represent the group of scores all that well.
One situation where this happens is with outliers. Consider the following N = 9 scores:
22, 22, 23, 23, 23, 23, 24, 24, 158
If we were to calculate the mean, it would come out as 38. However, the number 38 doesn’t really describe that group of scores all that well. Most of the people in the group are scoring right around 23. An outlier, the score of 158, gets included in the calculation of the mean, and pulls the mean higher than the other eight scores.
In this situation, the median would be a better measure of center because it is only concerned with the scores in the middle of the distribution. In this case, the median would be 23, which is a much better indication of how this group performed.
Another situation that is similar to this is when we are working with a skewed distribution. Because in a skewed distribution the bulk of the scores are bunched at one end of the distribution, while there is a small tail of scores that stretches out at the other end of the distribution, this tail can throw off the mean. In a way, it is similar to the outlier we just discussed but now it isn’t usually just one score but instead a few scores in the tail.
Consider the following distribution of children living within the family:
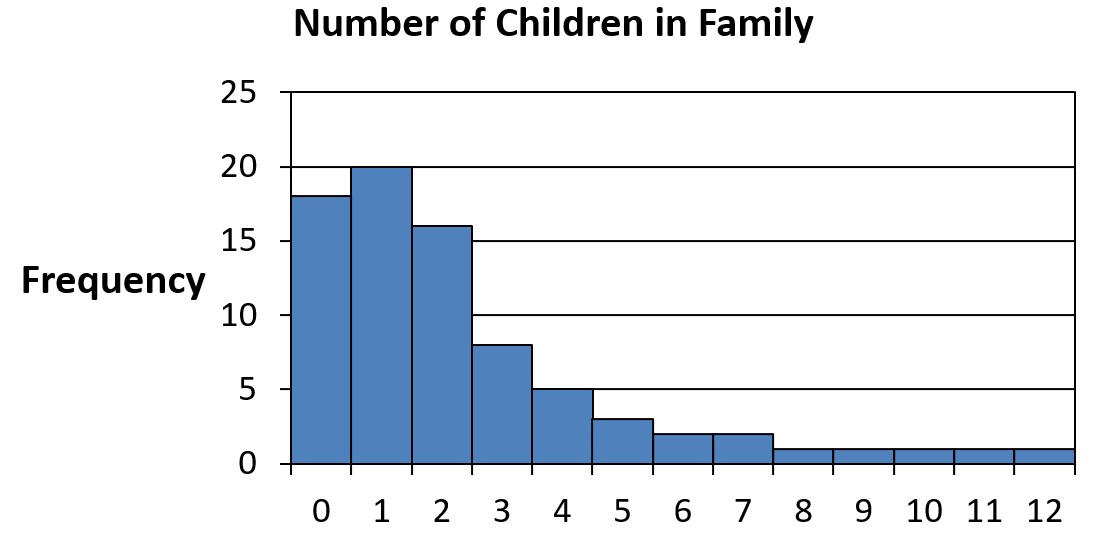
The average number of children is 2.37, but you can see that the vast bulk of families have between 0 and 2 children, not more than 2 children. As before, that long tail to the right of a few families that have a large number of children is having an effect on the mean. In this case, it would again be better to use the median as our measure of center, which would be 2 (half of the families have less than 2 children; half have more than 2 children).
Mean Is Impossible to Calculate
The other situation where we won’t use the mean is when we can’t use the mean. As we discussed, the mean is calculated based on every score in the distribution. Sometimes, though, we don’t actually have every score in a distribution. This usually occurs when there is something wrong with our measurement, or when an individual doesn’t complete the measured task.
When to Use the Mean
So, in the end, use the mean as your measure of center unless you can’t measure it or it isn’t the best measure of the group performance.
When to Use the Median
Use the median when the mean isn’t the best measure of center or can’t be calculated. It is also the measure of center for ordinal data.
When to Use the Mode
Use the mode for nominal data. Also, the mode can be useful with discrete data when the mean gives you an impossible number. For example, if you wanted to calculate the average number of cats per household, it might come out as a fraction such as 1.254 cats per household. Including the mode as well can be helpful. The average number of cats per household is 1.254, with the modal number being 0.
Test Score Example Revisited
Now, let’s go back to one of the original questions at the beginning of this chapter…
Suppose you got an email telling you that you earned a 65 on a test. How would you feel?
As we discussed, you would probably want to know the total number of possible points on the test, which is 100. And then you would probably want to know how everyone else in the class performed. We now know that we should try to use a mean as long as the data isn’t skewed, or there isn’t an outlier. In this case, the data is not skewed, and there are no outliers, so we are good with a mean.
Let’s say the mean for the class on the test was 65. Now how do you feel?
Those feelings probably depend upon the person. Some will be happy to be average, some will not. The mean simply gives us a sense of how the group performed in general. In other words, a score of 65 is the most “typical” or “average” score for the group. If you are happy being with the group (and not behind), you might feel good. If you expected to outperform the group, you might feel unhappy.
However, there is another question that you should ask in order to get the best sense of how you performed relative to the group. How spread out are the scores?

Feedback/Errata