
6.4 – Finding Proportions or Probabilities from Z-scores
Using the Unit Normal Table to Find Proportions
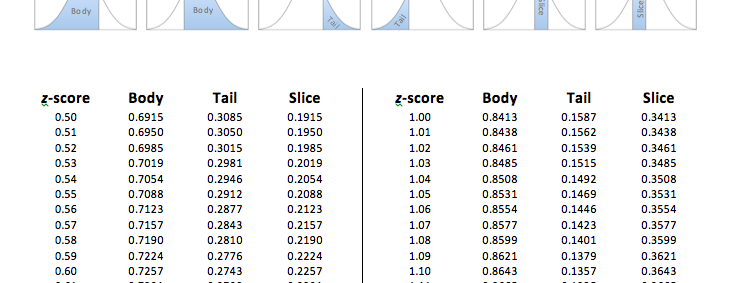
The Unit Normal Table is arranged in 4 columns. The first column lists the z-scores from 0.00 to 4.00, out to two decimal places. The second column, labeled Body, lists the proportion of the normal distribution in the “body” for each z-score. The third column, labeled Tail, lists the proportion of the normal distribution in the “tail” for each z-score. The fourth column, labeled Slice, depicts the proportion of the normal distribution between each z-score and the mean, which we will refer to as a “slice.”
As you can see in the pictures below, the body is the larger proportion of the normal distribution in relation to each z-score, while the tail is the smaller proportion (an easy way to remember this is that for animals, the big part of the animal is typically the body and the smaller part is the tail). And, finally, the slice is the proportion between the mean (μ = 0) and the z-score.
|
|
|
|
|
|
|
|
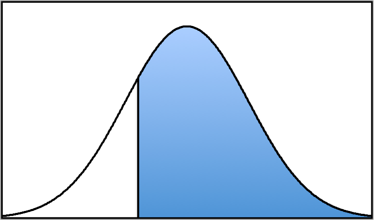 Body
Body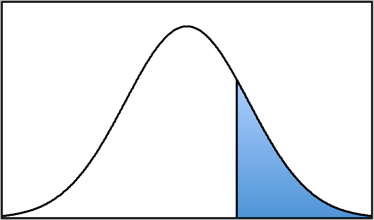 Tail
Tail Slice
Slice Body
Body Tail
Tail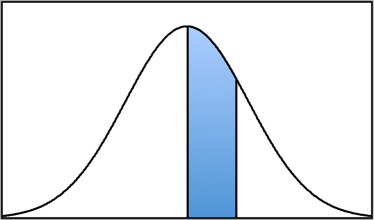 Slice
SliceNotice that the determination of body, tail, or slice does not depend upon the side of the distribution. In fact, the best way to determine which column of the Unit Normal Table to look in for the proportion, you should follow these steps:
How to find the proportion/probability for a given range of z-scores
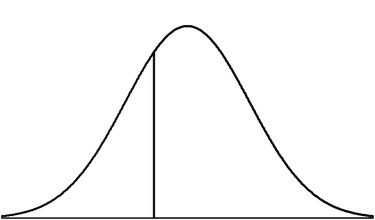
- Draw a picture of the normal distribution curve.
- Draw a vertical line in the middle of the distribution.
- Label this middle line with a z = 0 (this step is optional, but it can help).
- Locate the z-score on the curve (approximately) and label it with a vertical line.
- Shade the appropriate part of the distribution (e.g., above the z, below the z, between the mean and the z).
- Look at the shaded chunk and decide if it is a body, a tail, or a slice.
- Look up your z-score in the first column of the Unit Normal Table.
- Then go across that row to the appropriate column (Body, Tail, or Slice) to get your answer.
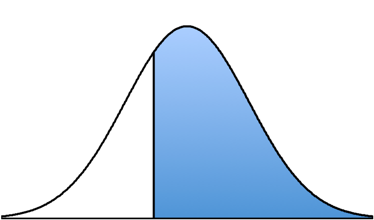
Let’s say we want to know: “What proportion of the normal distribution lies above a z-score of z = +1.00?”
First, we draw a normal distribution curve:
Then we locate the z-score on the curve. Since a z-score of +1.00 is above the mean by 1.00 standard deviation, we can put a vertical line to the right of the mean. At this point, it doesn’t matter if it is exactly accurate because we only are using it to determine what proportion column (body, tail, or slice) to use.
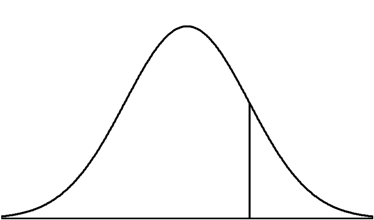
Now because we want to know the proportion of the normal distribution that lies above (or is greater than) the z-score of z = +1.00, we shade the part of the distribution for all z-scores higher than +1.00 (or to the right of the vertical line at z = +1.00). In other words, we want the following proportion: P (z > +1.00).
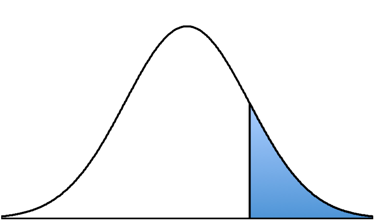
Looking at that picture, we can see that the shaded area is a “tail.” We then go to the Unit Normal Table and look for our z-score of z = +1.00 in the z-score column. Then we look across that row until we come to the Tail column, and we find a proportion of P (z > +1.00) = 0.1587. In other words, 15.87% of the normal distribution lies above a z-score of z = +1.00.
Because the normal distribution is symmetrical, we don’t need to include any negative z-scores in the Unit Normal Table. Once we figure out which column to use (Body, Tail, or Slice), we can then use the matching positive z-score.
For example, what is the proportion of the normal distribution that lies above a z-score of z = -0.55? To answer this, we simply follow our steps as we did before.
First, we draw a normal distribution curve:

Then we locate the z-score on the curve. Since a z-score of -0.55 is below the mean by a little more than ½ of a standard deviation, we can put a vertical line to the left of the mean. At this point, it doesn’t matter if it is exactly accurate because we only are using it to determine what proportion column (body, tail, or slice) to use.
Now because we want to know the proportion of the normal distribution that lies above the z-score of z = -0.55, we will shade the part of the distribution for all z-scores higher than -0.55. In other words, we want the following proportion: P (z > -0.55).
Looking at that picture, we can see that the shaded area is a “body.” We then go to the Unit Normal Table and look for our z-score of z = -0.55 in the z-score column.
However, there are no negative z-scores in the table. Since we know that the normal distribution is symmetrical, we know that the proportion of the normal distribution above z = -0.55 is the same as the proportion below z = +0.55.
So we can look up the Body for the z-score of z = +0.55. Then we look across that row until we come to the Tail column, and we find a proportion of P (z > -0.55) = 0.7088. In other words, 70.88% of the normal distribution lies above a z-score of z = -0.55.

Using the Unit Normal Table to Find Probabilities
As mentioned in the previous section, the proportion of the distribution that is shaded is equal to the probability of randomly sampling a z-score in that shaded region.
Because of this, we can then use the Unit Normal table to look up the proportion for a given part of the normal distribution (e.g., body, tail, slice, etc.), and that number will also tell us the probability of randomly sampling a z-score that happens to be in that part of the distribution.
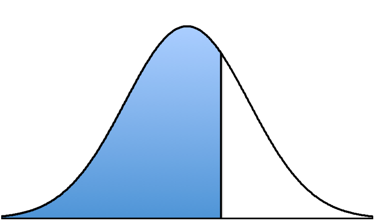
For example, let’s say we want to know: “What is the probability of having a z-score below z = +1.23? Or, in symbols, what is P (z < +1.23)?”
First, we draw a normal distribution curve:
Then we locate the z-score on the curve. Since a z-score of +1.23 is above the mean by +1.23 standard deviations, we can put a vertical line to the right of the mean. At this point, it doesn’t matter if it is exactly accurate because we only are using it to determine what proportion column (body, tail, or slice) to use.
Now because we want to know the proportion of the normal distribution that lies below the z-score of z = +1.23, we will shade the part of the distribution for all z-scores lower than +1.23 (or to the left of the vertical line at z = +1.23). In other words, we want the following proportion: P (z < +1.23).
Looking at that picture, we can see that the shaded area is a “body.” We then go to the Unit Normal Table and look for our z-score of z = +1.23 in the z-score column. Then we look across that row until we come to the Body column, and we find a proportion of P (z < +1.23) = 0.XXXX. In other words, XX.XX% of the normal distribution lies below a z-score of z = 1.23.
However, because we know that proportion equals probability, we also now know that the probability of having a z-score less than z = +1.23 is 0.XXXX. This can also be phrased in laypeople’s terms as: XX.XX% of z-scores are below a z = +1.23.

Feedback/Errata