
1.6 – Types of Data
Once a researcher has operationally defined their variables, we can then examine what kind of quantitative result is obtained.
Discrete vs. Continuous Variables
One of the simpler ways to describe the measurement results is whether they are discrete or continuous. A discrete variable provides scores that are discrete or separate. For example, the year you were born is a discrete variable because each year is a separate numerical value. A continuous variable, on the other hand, provides scores that are continuous, meaning that they are infinitely divisible. This means that you can take any two particular scores and find a score in between them, and you can do this infinitely. For example, height is a continuous variable because you can take any two heights and technically find a height in between them. Take 5 feet 8 inches tall and 5 feet 9 inches tall. You can theoretically find a height in between, such as 5 feet 8 ½ inches tall. Then you can take 5 feet 8 inches tall and 5 feet 8 ½ inches tall and find a height in between, such as 5 feet 8 ¼ inches tall. And you can just keep doing this forever.
Scales of Measurement
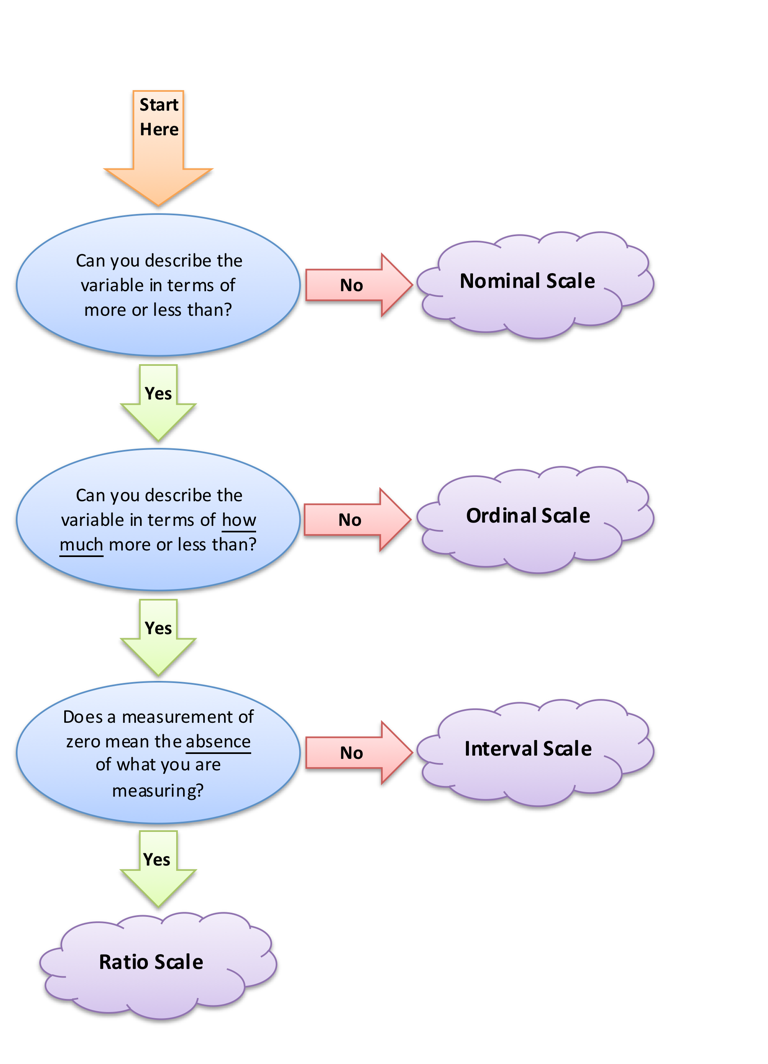
Another way of describing the quantitative results of our variables is to examine the scales of measurement: nominal, ordinal, interval, or ratio (Stevens, 1946). These scales provide us with even more information about the quantitative information in our data.
Nominal scales contain scores that simply “name” or describe the different categories. Take the variable of gender, for example. The results are simply “male” or “female,” which are just the names for the different categories.
Ordinal scales contain scores that (a) name the different categories, but also (b) include some numerical information, specifically the “order,” or which scores are higher or lower, or more or less. For example, clothing size is an ordinal scale. “Small,” “medium,” and “large” describe the categories, and yet they also indicate which size is bigger or smaller.
Interval scales contain scores that (a) name the different categories and (b) indicate order, but also (c) include a measurement of exactly how much higher or lower. For example, when we measure temperature in Celsius or Fahrenheit, the temperature describes how much heat there is in degrees and we know which temperatures are hotter or colder than others, and yet they also indicate exactly how much hotter. For example, 85° is 10 degrees hotter than 75°.
Ratio scales contain scores that (a) name the different categories, (b) indicate the order, and (c indicate how much higher or lower, but also (d) include a zero value that means the lack of any of what you are measuring. This non-arbitrary zero allows for the ability to describe the results in ratios (e.g., “twice as much,” or “one-third as much”). For example, when we measure temperature in Kelvin, 0° Kelvin (“absolute zero”) means the absence of heat. It is the theoretical point at which molecules stop moving, thus generating no heat. Because the zero point on the scale refers to the actual absence of what we are measuring (heat), then we are working with a ratio scale and we can talk about ratios. Thus, 100° Kelvin is twice as hot as 50° Kelvin, or 20° Kelvin is one-fourth as hot as 80° Kelvin.
The flowchart below can help you determine the scale of measurement.
Here are some other examples for each of the different scales of measurement:
|
Nominal Scale |
Gender, race/ethnicity, college major, nationality, city, food group |
|
Ordinal Scale |
Race finish, class rank, movie rating stars, food ratings (e.g., grade A, grade AA) |
|
Interval Scale |
IQ test scores, personality test scores, grade point average, latitude |
|
Ratio Scale |
Height, weight, age, number of errors made, race time, income |
You may find that some of the distinctions between categories are a bit elusive. You are not alone. In fact, some statisticians find problems with the scales of measurement. However, they are useful to explore and they can be very helpful with some statistical decisions we will make in the future. One of the most important aspects is that knowing the scale of measurement can tell you if a particular inferential statistic can be calculated with the data you collected. Most of the inferential statistics we will cover in this book require that you are working with either interval or ratio data. If your data is not interval or ratio data, you simply can’t use most of the basic inferential statistics you will learn.
A variable that produces a range of scores that are discrete or separate from one another.
A variable that produces an infinite range of scores. In other words, there are an infinite number of possible scores because you can always find a possible score between any two scores.
A way of classifying the amount of quantitative, or numerical, information contained in a particular measure.

Feedback/Errata