
6.3 – The Normal Distribution
The Normal Distribution
Statisticians love the normal distribution, or normal curve. The normal distribution is a distribution of scores where most of the individuals being measured fall in the middle, and as you go further from that middle you get fewer and fewer scores. That bell-shaped distribution is a key part of most of the inferential statistics that we will learn.
One of the interesting characteristics about the normal distribution is that it appears to be naturally occurring. Many things in nature tend to be normally distributed. For instance, things like height and weight are normally distributed, as are many psychological concepts like intelligence and personality. In fact, the normal distribution seems to be the result of any characteristic that is affected by a number of random factors.
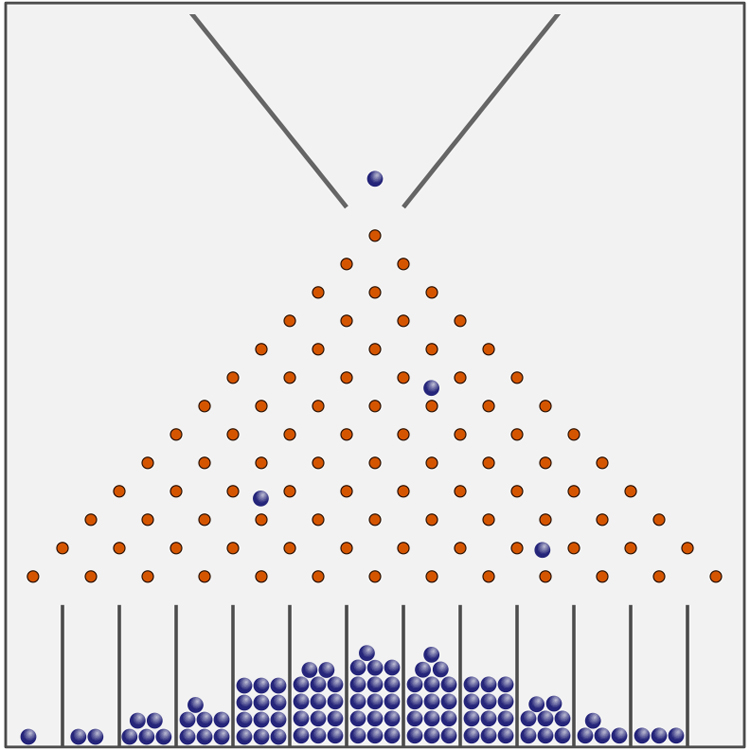
In the picture above, a red ball is dropped from the top. It will then hit one of the blue pins and bounce in a random direction. As the ball bounces down it will hit other pins and again bounce in a random direction. After doing this a number of times, it ends up in one of the bins at the bottom. If you do this with enough ball the graph at the bottom will start to approximate a normal distribution.
Using z-scores and the Normal Distribution to Determine Probabilities
Another useful characteristic of the normal distribution is that can be graphed using the following formula:
y=1σ2πe-(x-μ)22σ2
Now don’t worry, we won’t be using that formula at all. However, I include it so that you can see that there is a formula for calculating where the normal curve is at any particular X value. So, if we know exact shape of the curve, it is possible to calculate the exact amount of area under the curve so that we can determine the proportion of normal distribution that is shaded.
Again, don’t worry because you won’t have to do any of that calculating. It has already been done for us. We will simply use a table to look up our proportions.
Table A1, in Appendix A, is called the Unit Normal Table, and it provides a list of any of the proportions in a normal distribution we will need for z-scores from 0.00 to 4.00. We will use it in two ways:
- Look up a proportion based upon a particular z-score.
- Look up a z-score based upon a particular proportion.

Feedback/Errata