
1 1.5 Human Population and Sustainability
Human Population
The study of population has never been more important than it is today. We are close to 8 billion people on the planet, but most of this growth has occurred in the last 100 years, in developing nations. With a projected population growth between 9-11 billion by 2050 and the effects of climate change in the environment, we can reasonably expect the impact of geological disasters to be greater.
The overall purpose of this chapter is to introduce the population distribution and population growth issues that can exacerbate geological processes and turn them into disasters and catastrophes. This course emphasizes a geographic perspective on population growth as a relative concept. Human-environment interaction and overpopulation can be discussed in the contexts of carrying capacity, as well as the relationship between people and resources. This chapter also identifies the main reasons why people migrate over time: economic, political, cultural, and environmental.
Population Growth
Humans do not live uniformly around the planet, but in clusters. This is because of the earth’s physical geography and the distribution of resources. Environments that are too dry, wet, cold, or mountainous create a variety of limiting factors for humans. Two-thirds of the world’s population is within four major clusters: East Asia (China), South Asia (India and Indonesia), Southeast Asia, and Europe, with the majority in East and South Asia.
Geographers study where and why people live in particular locations. Regarding population growth, geographers emphasize three elements: 1. the population size; 2. the rate of increase of world population; 3. the unequal distribution of population growth. Geographers seek to explain these patterns.
Demography is the study of how human populations change over time and space. It is a branch of human geography related to population geography, which is the examination of the spatial distribution of human populations. Geographers study how populations grow and migrate, how people are distributed around the world, and how these distributions change.
For most of human history, relatively few people lived on Earth, and the world population grew slowly. Only about five hundred million people lived on the entire planet in 1650 (that is less than half India’s population in 2000). Things changed dramatically during Europe’s Industrial Revolution in the late 1700s and into the 1800s when declining death rates due to improved nutrition and sanitation allowed more people to survive to adulthood and reproduce. The population of Europe exploded. However, by the middle of the twentieth century, birth rates in developed countries declined, as children had become a financial liability rather than an economic asset to families. Fewer families worked in agriculture, more families lived in urban areas, and women delayed the age of marriage to pursue education, resulting in a decline in family size and a slowing of population growth. In some countries (e.g., Russia and Japan), the population is actually in decline, and the average age in developed countries has been rising for decades. The process just described is called the demographic transition.
At the beginning of the twentieth century, the world’s population was about 1.6 billion. One hundred years later, there were roughly six billion people worldwide, and as of 2011, the number was approaching seven billion. This rapid growth occurred as the demographic transition spread from developed countries to the rest of the world. During the twentieth century, death rates due to disease and malnutrition decreased in nearly every corner of the globe. In developing countries with agricultural societies, however, birth rates remained high. Low death rates and high birth rates resulted in rapid population growth.
Meanwhile, birth rates and family sizes have also been declining in most developing countries as people leave agricultural professions and move to urban areas. This means that population growth rates, while still higher in the developing world than in the developed world, are declining. Although the exact figures are unknown, demographers expect the world’s population to stabilize by 2100 and decline somewhat.
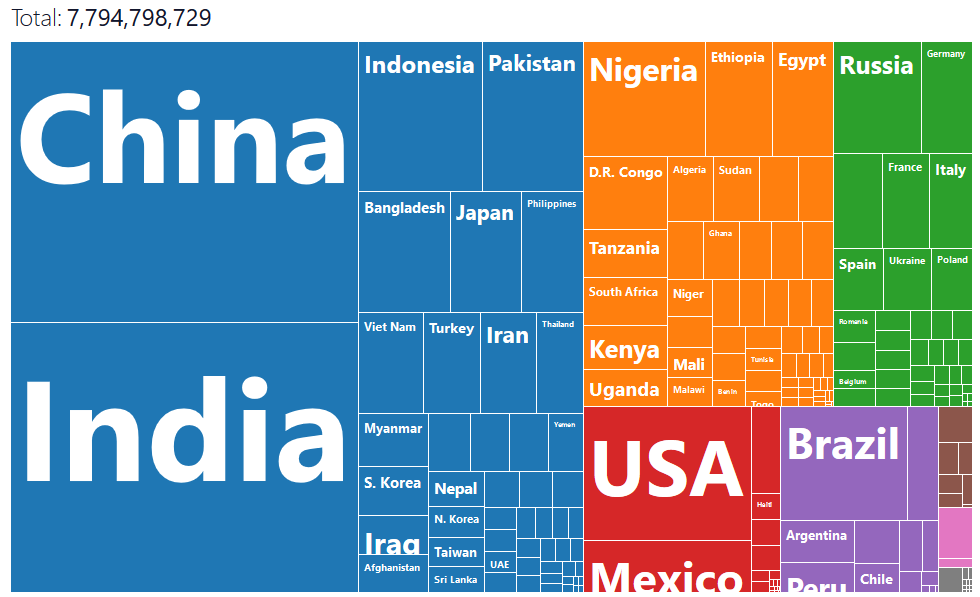
The world’s population growth rate has been mostly occurring in developing countries, whereas populations are stable or in a decline in places such as Europe and North America. The world population increase is more pronounced on the continent of Asia: China and India are the most populous countries in the world, each with more than a billion people, and Pakistan is an emerging population giant with a high rate of population growth (Fig. 1.9). The continent of Africa has the highest fertility rates in the world. The most striking paradox within population studies, is that while there has been a decline in fertility (a declining family size) in developing countries, the world’s population will grow substantially by 2030 because of the compounding effect of a large number of people already in the world. Even though population growth rates are in decline in many countries, the population is still growing. A small growth rate on a broad base population still results in the birth of many millions of people.
As of June 2021, the United States Census Bureau estimates that the world population is nearly 7.76 billion, with a growth rate of roughly 1.07 percent, or roughly 82 million people per year. The world population reached 6 billion in 1999 and 7 billion in 2011. If the current growth rate continues, the human population will reach 8 billion by 2023 and hopefully level off at roughly 10 billion by 2055. Between 2010 and 2050, world population growth will be generated exclusively in developing countries.
The three most significant population clusters in the world are the regions of eastern China, South Asia, and Europe. Southeast Asia also has large population clusters. Additional large population centers exist in various countries with high urbanization. An example is the urbanized region between Boston and Washington, DC, which includes New York City, Philadelphia, Baltimore, and neighboring metropolitan areas, which is often called a megalopolis. The coastal country of Nigeria in West Africa or the island of Java in Indonesia are good examples of large population clusters centered in the tropics.
Social dynamics and geography will determine where the new additions to the human family will live. Providing food, energy, and materials for these additional humans will tax many countries of the world, and poverty, malnutrition, and disease are expected to increase in regions with poor sanitation, limited clean water, and lack of economic resources. In 2010, more than two billion people (one-third of the planet’s population) lived in abject poverty and earned less than the equivalent of two US dollars per day. The carrying capacity of the planet is not and cannot be known. How many humans can the earth sustain indefinitely? There is the possibility that we have already reached the threshold of its carrying capacity.
The human population will continue to grow until it either crashes due to the depletion of resources or stabilizes at a sustainable carrying capacity. Population growth exacts a toll on the earth as more people use more environmental resources. The areas most immediately affected by increased populations include forests (a fuel resource and a source of building material), freshwater supplies, and agricultural soils. These systems get overtaxed, and their depletion has serious consequences. Type C climates, which are moderate and temperate, are usually the most productive and are already vulnerable to severe deforestation, water pollution, and soil erosion. Maintaining adequate food supplies will be critical to supporting a sustainable carrying capacity. The ability to transport food supplies quickly and safely is a significant component of managing the conservation of resources. Deforestation by humans using wood for cooking fuel is already a serious concern in the arid and dry type B climates.
Population Demographics
The Industrial Revolution, which prompted the shift in population from rural to urban, also encouraged market economies, which have evolved into modern consumer societies. Various theories and models have been developed over the years to help explain these changes. For example, in 1929, the American demographer Warren Thompson developed the Demographic Transition Model (DTM) to explain population growth based on an interpretation of demographic history. A revised version of Thomson’s model outlines five stages of demographic transition, from traditional rural societies to modern urban societies.

Stage 1: Low Growth Rate
Humans have lived in the first stage of the DTM for most of our existence. In this first stage, CBRs and CDRs fluctuated greatly regionally, globally, and over time because of living conditions, food output, environmental conditions, war, and disease. Ultimately, the natural increase of the world was stable because CBRs and CDRs were about equal. However, around 8,000 BC, the world’s population grew dramatically because of the agricultural revolution. During this time, humans learn to domesticate plants and animals for personal use and became less reliant on hunting and gathering for sustenance. This allowed for more stable food production and allowed village populations to grow. War and disease prevented population growth from occurring on a global scale.
Stage 2: High Growth Rate
Around the mid-1700s, global populations grew ten times faster than in the past because of the Industrial Revolution. The Industrial Revolution brought with it a variety of technological improvements in agricultural production and food supply. Increased wealth in Europe and later North America, because the Industrial Revolution meant that more money and resources could be devoted to medicine, medical technology, water sanitation, and personal hygiene. Sewer systems were installed in cities; thus, public health improved. All of this dramatically caused CDRs to drop around the world. At first, CBRs stayed high as CDRs dropped, causing populations to increase in Europe and North America. Over time, this would change.
Africa, Asia, and Latin America moved into Stage 2 of the demographic transition model 200 years later for different reasons than their European and North American counterparts. The medicine created in Europe and North America was brought into these developing nations, creating what we now called the medical revolution. This revolution or diffusion of medicine to this region caused death rates to drop quickly. While the medical revolution reduced death rates, it did not bring with it the wealth and improved living conditions and development that the Industrial Revolution created. Global population growth is most significant in the regions that are still in Stage 2.
Stage 3: Moderate Growth Rate
Today, Europe and North America have moved to Stage 3 of the demographic transition model. A nation moves from Stage 2 to Stage 3 when CBRs drop while CDRs remain low or even continue to fall. It should be noted that the natural rate of increase in nations within Stage 3 is moderate because CBRs are higher than CDRs. The United States, Canada, and nations in Europe entered this stage in the early 20th century. Latin America entered this stage later in the century.
Advances in technology and medicine cause a decrease in IMR and overall CDR during Stage 2. Social and economic changes bring about a decrease in CBR during Stage 3. Countries that gain wealth have fewer children as they move away from rural-based development structures toward urban-based structures because more children survive childhood, and the need for large families for agricultural work decreases. Women gained more legal rights and entered the workforce, own property, and have fewer children as nations move into Stage 3.
Stage 4: Return to Low Growth Rate
A country enters Stage 4 of the demographic transition model when CBRs equal to or become less than CDRs. When CBRs are equal to CDRs, a nation will experience zero population growth (ZPG). This occurs in many countries where girls do not live as long as they reach their childbearing age due to gender inequality.
A country in the first two stages of the transition model will have a broad base of young people and a smaller proportion of older people. A country in Stage 4 will have a much smaller base of young people (fewer children), but a much larger population of elderly (decreased CDR). A country with a large youth population is more likely to be rural with high birth rates and possibly high death rates, helping geographers analyze a nation’s health care system. A country in Stage 4 with a large elderly population will have much fewer young people supporting the economy. These two examples represent the dependency ratio, as mentioned earlier in this chapter. This ratio is the number of people, young and old, dependent on the working force.
Human geographers like to focus on the following demographic groups: 0-14 years old, 15-64 years old, and 65 and older. Individuals 0-14 and over 65 are considered dependents (though this is changing in older generations). One-third of all young people live in developing nations. Moreover, this places a considerable strain on those nations’ infrastructure, such as schools, hospitals, and daycare. Older individuals in more developed nations (MDL) benefit from health care services, but require more help and resources from the government and economy.
Another ratio geographers look at is the number of males compared to females, called the sex ratio. Globally, more males are born than females, but males have a higher death rate than females. However, understanding a country’s sex ratio and its dependency ratio helps human geographers analyze fertility rates and natural increases.
As noted earlier, population growth has exploded in the last century. No country is still in Stage 1, and very few have moved into Stage 4. most of the world is either in Stage 2 or 3, which both have higher CBRs than CDRs, creating a human population of over 7.5 billion today.
Stage 5: Population Decline
Many demographers believe a new stage in the DTM should be added to address issues starting to develop in countries within Europe and Japan. In this final stage, CBR would be extremely low and an increasing CDR. This would cause the area’s NIR to become negative, leading to declining population growth. This may create an enormous strain on the social safety net programs of a country as it tries to support older citizens who are no longer working and contributing to the economy.
Future of Population Growth: Ethics and Politics
What is overpopulation? Most people equate overpopulation with crowding but, in fact, density is largely irrelevant to questions of overpopulation. What is relevant is carrying capacity. An area is overpopulated when its long-term carrying capacity is being degraded by its current human occupants.
How many people can the Earth support? That depends on people’s lifestyles, which impacts the rates at which resources are consumed. In more affluent countries, resources are consumed at a greater pace to enable residents to eat a diet with more animal products, use more energy in homes, and produce more goods. So, if everyone lived as they do in wealthier countries, fewer people could be supported by Earth’s resources than live on the planet today. The average rates at which people consume resources like oil and metals, and produce wastes like plastics and greenhouse gases are about 32 times higher in North America, Western Europe, Japan and Australia then they are in the developing world.1 In the least developed countries, people use fewer resources, but often suffer from malnutrition and fewer opportunities to lead healthy lives and contribute to their nation’s economy.
Global demand for natural resources has doubled in the past 50 years. Our ecological footprint is a measure of how fast we consume resources and generate waste compared to how fast nature can absorb our waste and generate new resources. Scientists calculated that since the 1970s, our demand for resources has exceeded what the Earth can regenerate in a year. It now takes 1.6 years to regenerate what we use in one year.2 Rather than consider how many people could live on Earth, we should consider a sustainable balance of people and resources that raises the standard of living around the globe without degrading the environment.
Environmental Impacts
There are many ways in which our large and growing human population impacts the global environment. Using resources faster than they can be replenished is just part of the issue. Over the past 50 years, humans have altered ecosystems more rapidly and extensively than in any other comparable period in history, primarily to meet the rapidly growing demands for food, freshwater, timber, fiber, and fuel.
Climate Change: Our global temperature is on the rise due to the ever-increasing amount of greenhouse gases that are emitted through human activities including fossil fuel use, deforestation, and livestock grazing. This warming is causing sea-level rise from Arctic ice melt, more extreme weather, and loss of habitat including coral reefs. Population growth only exacerbates climate change, as more people demand more food and energy. With renewable energy supplying only a small fraction of total energy use, fossil fuel use is expected to expand for the foreseeable future.
Water Scarcity: About 35 percent of the world’s people already face chronic water shortages. As the population grows, more water is needed for agriculture and industry, as well as for domestic uses. A child born in the developed world consumes 30-50 times as much water as one born in the developing world. The worldwide supply of clean, accessible water is further reduced by pollution. In 2011, 768 million people were without safe drinking water and 2.5 billion lacked basic sanitation.
Biodiversity Loss: Nearly all the world’s ecosystems are shrinking to make way for more humans and their homes, farms, factories, and shopping centers. Globally, 13 million hectares of forest (about the size of Costa Rica) were lost each year from 2000 to 2010, as much of it was cleared or degraded from human activities. Forests play an important part in climate change mitigation. Forests store a vast amount of carbon. When we cut down a forest to convert it for another use, we release carbon back into the atmosphere. The World Wildlife Fund’s Living Planet Index shows a 30 percent decline in the Earth’s biodiversity since 1970; a 60 percent decline in the tropics. According to the World Conservation Union, 1 in 3 amphibians, 1 in 4 mammals, 1 in 8 seabirds, and 70 percent of plants are at risk of extinction due primarily to human alteration of their habitats.8 Humans depend on rich biodiversity for survival—food, medicines, climate regulation, and more.
Unnatural Disasters
Former UN Security General Kofi Annan has said, “The term natural disaster has become a misnomer increasingly. Human behavior transforms natural hazards into unnatural disasters.” Most deaths from natural disasters occur in less developed countries. According to the United Nations, a less developed country (LDC) is a country that exhibits the lowest indicators of socioeconomic development and ranked among the lowest on the Human Development Index. Those who live in low-income environments tend to have the following characteristics:
- Live in areas that are at a higher risk to geologic, weather, and climate-related disasters
- Live in areas that lack the economics and resources to provide a safe living infrastructure for its people
- Have few social and economic assets and a weak social safety net
- Lack the technological infrastructure to provide early warning systems
As human populations have grown and expanded, and technology has allowed us to manipulate the environment, natural disasters have become more complex and arguably more “unnatural.” There are a variety of ways humans have not only influenced but magnified the impacts of disasters on society. For simplification, this book will narrow it down to four: human population growth, poverty and inequality, environmental degradation, and climate change.
What Will the Future Hold for People and the Planet?
Sustainability can be achieved if the population stabilizes, and resources are used efficiently. The good news is that the very conditions that will help the population stabilize are those that help people live longer, healthier lives, raise healthier children, and enjoy greater prosperity. These include universal education and gender equality, access to reproductive health care, and family planning services. Achieving ecologically sustainable lifestyles will take ingenuity and a sense of shared responsibility for the ecosystems that sustain us all. Richer nations will need to reduce their large footprints and emerging economies will need to find new models of growth to improve their citizens’ well-being in ecologically sustainable ways.
