Section 5.5: Sample Size and Precision
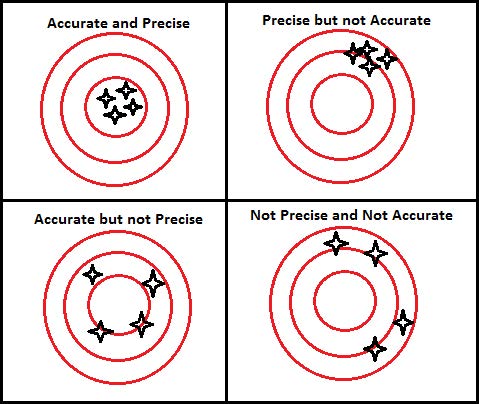
Now we know how the sample size relates to the Margin of Error. We can use this information to choose a sample size. The sample size chosen depends on how much precision we want in our estimate. The diagram below illustrates the concepts of precision and accuracy which are often confused. Suppose the diagrams below are dartboards and the true value of the percentage of voters who will vote for the proposition is in the centermost point. An estimate is precise, when multiple measurements would give you values close together. An estimate is accurate, when multiple measurements are close to the true value.

The accuracy of our estimate is not quantified, but Statisticians investigated the idea and agree that the best possible estimate we can make where we garner the most information
from our sample is the sample proportion , 𝑝̂ . This doesn’t mean that we can’t get a 𝑝̂ that is far from the true value of the percentage. In fact, theoretically, p could equal 75% and it is
possible to get an estimate of 𝑝̂ = 0%. It’s not likely, but it could happen. Instead it means that our best chance is to use a sample proportion to estimate the population proportion.
In terms of precision, as the sample size increases, the likelihood of the precision of our percentage estimate also increases. Theoretically, we want as much precision as possible, but increasing the sample size means surveying more people which costs time and money. Additionally, the increase in precision is not proportional to the increase in sample size. Meaning, doubling the sample size does not double the precision.
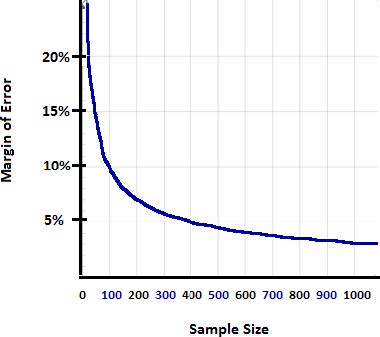
The graph below shows that as the sample size increases, the margin of error decreases. However notice that it is not a straight line. For a sample size of 100, the MOE is 10%, but to attain a MOE of 5%, you will need a sample size 4 times greater than 100 or 400.

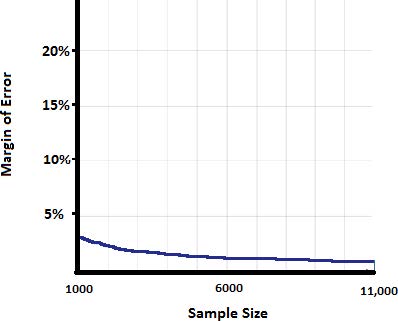
The graph continues to flatten out as the sample size increases as shown in the graph below for sample sizes between 1000 and 11,000.
A sample size of 1000 has a MOE of 3.2%. A sample size of 6000 has a MOE of 1.3%. A sample size of 11,000 has a MOE of 1.0%.

So although increasing sample size will increase precision, the amount of increase may not warrant the cost and time of choosing an even larger sample. To determine the sample size
needed if given the desired Margin of Error, we may compute n = [latex]\frac{1}{MOE^2}[/latex] , where MOE is written as a decimal.
