SECTION 4.1: Statistics, Probability, and Key Terms
It is essential to realize that you must approach the study of statistics much differently than you would approach a class like College Algebra or Calculus. Be sure to give yourself time to understand the concepts deeply. Spend time thinking about the concepts and definitions. Read the book and start the homework early enough that you have time to really understand each problem. Memorizing definitions and techniques will not guarantee successful completion of the course. Statistics is not a typical math topic. It is really more of a critical thinking topic.
Before taking a statistics class, most people associate the term statistics with what a statistician would call descriptive statistics. We are using descriptive statistics when we use numbers or graphs to summarize a data set by calculating a mean or making a bar graph, for example. Descriptive statistics are essential to the field of statistics, but they will consume only a small portion of the statistics.
The primary goal of statistics is to begin a study of inferential statistics: drawing conclusions based on limited information (our data) and quantifying the accuracy of our conclusions. Confidence intervals and hypothesis tests are two of the tools of inferential statistics that we will explore. The tools of inferential statistics require probability, so our statistics will include a study of basic probability concepts.
Examples
Example 1: Suppose a pharmaceutical company seeks FDA approval for a particular medication that has migraine headaches as a rare side effect. The FDA may require a scientifically valid estimate of the percentage of consumers of the medication who experience this side effect.
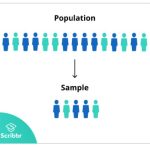
The pharmaceutical company cannot possible know the exact percentage of all eventual users of the medication who will experience migraines. That would require knowing information about every single user ever of the medication, even future users. In the context of this study, the collection of all users of the medication is the population of interest.
Since it is impossible to test every member of the population, the company must do the next best thing and test a representative sample of the population. In other words, the company must run an experiment in which some people are given the
 medication, then use the data from this sample to draw conclusions about the population.In summary…
A population is the entire group that you want to draw conclusions about.
A sample is the specific group that you will collect data from. The size of the sample is always less than the total size of the population. In research, a population doesn’t always refer to people.
Descriptive statistics describe data like a chart or graph.
Inferential statistics allow you to make predications (“inferences”) from data. With inferential statistics you take data from samples and make generalizations about a population.
A number that describes an aspect of a population is called a parameter such as the mean of the population data.
A number that describes an aspect of a sample is a statistic, such as the mean of the sample data. Generally, parameters are unknown values that we use inferential statistics to estimate.
Section 4.1 You Try ProblemS:
A) Identify the parameter and statistic in the previous example.
Notice that the parameter is unknown (and can never be known in this case), but the statistic is known after running the experiment and collecting data. The statistic is our best guess of the unknown parameter.
A variable is a characteristic of interest about a subject. We use capital letters to name variables, such as X . The answer to the question “what is the variable in this scenario?” is a verbal description of one piece of information we are collecting from each subject.
The data (the singular form is datum) are the actual values that are collected about each subject.
B) Continuing the same example, identify the variable, X, and the possible data values, x.
C) You wish to determine the average (mean) number of glasses of milk college students drink per day. Suppose yesterday in your Math class you asked every students how many glasses of milk they drank the day before. The answers were 1, 0, 1, 3, and 4 glasses of milk.
Identify the population, sample, parameter, statistic, variable, and data for this study.
4.1 – Answers to You Try Problems
a)
Parameter: Proportion of all users of the medication that get migraines
Statistic: Proportion of the sample of users of the medication that get migraines
b)
Variable: whether an individual gets a migraine
Data: yes or no
c)
Population: ALL students at the school Sample: All students in the English Class
Parameter: Proportion of school who drinks milk
Statistic: Proportion of the English Class who drinks milk
Variable: Average amount of glasses of Milk
Data: 0, 1, 3, 4
