Chapter 6 Genetics
Chapter 6 Outline:
6.1 Introduction to Genetics – Gregor Mendel, Pea Plants, & the Principles of Genetics
6.2 Genotypes and Phenotypes and the Use of the Punnett Square in Predicting Offspring
6.3 Non-Mendelian Genetics – Incomplete Dominance, Codominance, Multiple Alleles, & Polygenes
6.4 Environmental Effects on Phenotype (Epigenetics)
6.5 Epistasis and the Influence of Genes on other Genes
Learning Outcomes:
After studying this chapter, each student should be able to:
- 6.1 Describe how Gregor Mendel used his study of pea plants to discern the principles of genetics
- 6.2 Use Punnett Squares to determine the likely ratio of offspring in terms of both phenotype and genotype
- 6.3 Describe why certain genetic phenomena are described as Non- Mendellian
- 6.4 Describe how the environment might affect phenotypes independent of genetic influences
- 6.5 Explore the concept of epistasis and how this phenomenon differs from Mendelian principles
- 6.6 State at least one idea related to the future of genetics
6.1 Introduction to Genetics- Gregor Mendel, Pea Plants, & Principles of Genetics
The biotic world is made up of a great variety of organisms (biodiversity), from the bacteria that make your socks smell bad to the elephants one sees on safari (or in a zoo). As noted in an earlier chapter, living things are classified according to their common characteristics, such as cell structure, size, trophic level, or general “look”. Each of these characteristics depend largely on the genetic make-up of an organism. Closely related organisms, such as deer and elk, with elegant antlers on the males, share many genes. More distantly related organisms, such as grizzly bears and the salmon they like to eat, share fewer genes. Those two organisms share even fewer genes with the green algae they both encounter in streams.
In this chapter we will explore some of the early discoveries related to genetics, and see how new ideas and discoveries have been incorporated into this field of study. Genetics is still a fast evolving field of biology, with fascinating new discoveries being made each year. Some of these discoveries have important impacts on human health and our ability to study wildlife and the many other organisms we share this planet with.
Gregor Mendel – Writing the Rules of Heredity
In the mid 1800s, an Augustinian friar named Gregor Mendel (Figure 1) did experiments crossing different pea plants in his monastery garden. Mendel made quantitative observations on heredity about his pea plants, which lead him to formalize several principles about how traits are inherited (passed from parents to offspring – generation to generation). He conducted hybridization experiments that utilized purebred (“true breeding”) plants with specific qualities (characteristics or traits, such as always having purple flowers or low height).
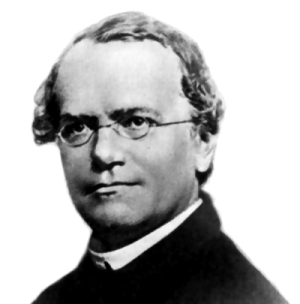
Figure 1. Gregor Mendel (1822-1884).
Fortunately the pea plant has seven easily noted characteristics that he could use for his experiments. These traits included plant height (long stem or short stem), flower color (purple or white), flower position (axial or terminal), seed shape (round or wrinkled), seed color (yellow or green), pod color (yellow or green), and pod shape (inflated or constricted) (Figure 2). Mendel bred these plants over many generations to observe how these characteristics were passed down from parent to offspring.

Figure 2. This chart shows the seven characteristics of pea plants that Mendel used in his genetic experiments. This figure also shows the dominant and recessive traits of each of these characteristics. (Credit: Pea Plant Characteristics, Mariana Ruiz, Wikimedia Commons)
Pea Plants and Flowers
The pea plant, Pisum sativum, (Figure 3) offered the advantage of allowing Mendel to control the fertilization process (by physically moving pollen with a small paintbrush from one plant to another plant), and the ability to produce large quantities of offspring in a short period of time. In simple experiments he could track the passage of a single trait like flower color (purple or white) through multiple generations. These single trait crosses were called monohybrid crosses, in which one trait (mono) is observed at a time. Mendel was able to formulate rules of heredity by carefully recording data from this work.
In the case of flower colors, pea plants either produced purple flowers (Figure 3a) for many generations (called true breeding or homozygous purple flower plants) or produced white flowers (Figure 3b) for many generations (true breeding or homozygous white flower plants). The true breeding plants that Mendel started with were referred to as the Parental Generation (P).


Figure 3. Pea plants (Pisum sativum)with (a) purple flowers and (b) white flowers (Credit: License: CCO Public Domain)
By removing the male parts of the pea flower (anthers containing pollen – Figure 4), Mendel was able to prevent each plant from self-pollination. Rather than allowing the plants to pollinate themselves, he used a paintbrush to transfer the pollen (male gamete) from a true breeding purple plant to the carpal (female plant part – Figure 4) of a true breeding white plant. He then collected the seeds produced by the hybridization breeding event, planted them, and observed the color of the flowers that were produced by the offspring plants.

Figure 4. Diagram showing the female part of the flower (the stigma) which receives pollen from the male part of the flower (the stamen). (Credit: modification of work by Mariana Ruiz Villareal)
The offspring are referred to as the First Filial Generation (F1). In the first generation (F1) that resulted from this particular monohybrid cross, all flowers were purple – even though the cross was between true breeding purple flowered and white flowered plants, no white flowers were produced by the offspring! So, the white flower trait seemed to disappear! At the time, most scientists thought that parental traits would always blend in the offspring, so Mendel needed to explore this surprising finding further.
Mendel then allowed the F1 plants to self-pollinate to generate a Second Filial Generation (F2). He then collected the seeds from this breeding event, planted them, and observed the colors of the flowers produced by the F2 generation. This second generation saw the re-emergence of some white flowered plants (that were absent in the F1 generation) in an approximate ratio of 3 purple flowered plants to 1 white flowered plants (3:1 ratio).
The loss of one variant of the trait (e.g. white colored flowers) in the F1 plants with the re-emergence of this trait in the F2 generation prompted Mendel to propose that each individual plant contains two hereditary factors (now called genes). Each offspring, therefore, must have inherited one of these particles from each parent.
Furthermore, the loss of one variant (e.g., purple color) in the F1 generation was explained by one variant of the gene masking the effect of the other variant of the gene, which Mendel described as dominance. In other words, the factor controlling the purple flower color masked the effect of the factor controlling white color. The re-emergence of the masked variation (the recessive variant) in the next generation was due to the fact that both recessive factors were inherited by the white flowered individuals. We now refer to these hereditary particles as genes and the variants of the traits as alleles. So in regard to the flower color gene – a plant with either two alleles for purple color or one allele for purple color and one allele for white color would both appear purple. Only the plants with both alleles for white color would appear white (referred to as homozygous recessive; homo is Greek for “same”). In Figure 2 above the dominant traits are illustrated in the top row of each column, while the recessive traits are shown in the bottom row of each column. Note that the dominant trait allele is represented by a capital letter, while the recessive trait allele has the same letter in lower case.
The following video uses chants and humor to help one learn more about Gregor Mendel and his work in genetics:
Landeo, Sergio (2012, May 1) Gregor Mendel – The Father of Genetics – Cell Song. [Video – YouTube] https://youtu.be/2xpTz7SUbnc
Mendel’s Principles of Genetics
The observations and conclusions that Mendel made from crossing pea plants helped him develop several principles related to how the inheritance of traits works. Mendel’s three principles of heredity are as follows:
Principle of Segregation
During gamete formation, the alleles for each gene segregate (separate) from each other so that each gamete (sperm or egg) carries one allele for each gene. Note that each offspring, therefore, has two alleles as the genes from each gamete (from the father and mother, usually sperm and egg) combine during sexual reproduction.
Principle of Dominance & Recessiveness
An organism with at least one dominant allele will show the phenotype (look or characteristic) of the dominant allele. This dominant phenotype will occur when the genotype contains either two dominant alleles (called homozygous dominant) or one dominant and one recessive allele (called heterozygous). The recessive phenotype will only appear when the genotype contains two recessive alleles (homozygous recessive).
Principle of Independent Assortment
During gamete formation, the two genes for a trait separate and each one becomes part of a new gamete independently of all other genes and their segregation. In other words, the fact that a gene for a tall plant becomes part of a gamete has no effect on whether a gene for white flower color becomes part of that same gamete. Genes segregate independently of each other!
Bill Nye, the science guy, describes Gregor Mendel and his work in this short but informative video:
Dgsbio400 (2012, May 1) Greatest Genetics Discoveries: Gregor Mendel.[Video – YouTube] https://youtu.be/0vAAf4g5iF8
6.2 Genotypes and Phenotypes and the Use of the Punnett Square in Predicting Offspring
The genotype refers to the genetic makeup (allele combination) of an individual organism. Since each plant has two alleles for each trait, the genotype for each gene can be described with the terms “homozygous”, meaning the same alleles, or “heterozygous”, meaning different alleles. Additionally, the homozygous conditions can be further distinguished by the presence of two dominant copies of the allele (homozygous dominant) or two recessive copies of the allele (homozygous recessive). Note that the heterozygous condition refers to the organism containing one dominant copy of the allele and one recessive copy of the allele, so it does not receive the qualifier as being dominant or recessive.
The phenotype refers to the physical expression (the “look” or characteristic) related to the expression of the genotype, or allele combination. For traits that manifest true dominance, the homozygous dominant and heterozygous genotypes will express the dominant trait as the phenotype. Only the homozygous recessive genotype will express the recessive trait as the phenotype. Table 1 shows the relationship between genotype and phenotype for traits that have complete dominance, such as the flower color of pea plants explained above.
Table 1. Examples of Genotypes and their related Phenotypes for Flower Color in Pea Plants. (source: Paul Bosch)
|
Genotype |
Phenotype |
| Homozygous Dominant (PP) | Purple Flowers |
| Heterozygous (Pp) | Purple Flowers |
| Homozygous Recessive (pp) | White Flowers |
Punnett Squares and Predicting the Likelihood of Offspring Types
The Punnett Square is a tool devised to make predictions about the probability of traits observed in the offspring and illustrate segregation during gamete formation. Remember that capital letters represent the allele for a dominant trait, while the same letter in lower case represents the allele for the corresponding recessive trait.
For example, to predict the offspring from a cross between a male gamete that is heterozygous for flower color (Bb) and a female gamete heterozygous for flower color (Bb), one could place the pollen (male) alleles at the top of the chart and the egg alleles (female) at the side of the chart as shown below. The Punnett square shown in Figure 5 represents a monohybrid cross, since only one trait (flower color) is being predicted for the offspring. As shown by the offspring in the inner boxes of the Punnett square, this particular cross between two heterozygous gametes (Bb) is predicted to produce offspring with the following genotypic and phenotypic ratios:
Probable Genotypic Ratios of Offspring
1BB : 2Bb : 1bb
Probable Phenotypic Ratios of Offspring
3 purple flower : 1 white flower
As noted above and in Figure 5, the probable genotypic ratio of the offspring is one homozygous dominant individual to two heterozygous individuals to one homozygous recessive individual, and is shown as 1BB:2Bb:1bb.
The predicted phenotypic ratio is three purple flowers to one white flower (3 purple:1 white).

Figure 5. Monohybrid Punnett square illustrating flower color inheritance. (Credit: Pea Plant Characteristics, Madeleine Price Ball, Wikimedia Commons)
Note that although these are the predicted ratios of offspring, actual ratios will vary somewhat from this. For example, if you flip a coin 10 times, you might predict getting five heads and five tails. But in reality, the results may include six heads and four tails. For this reason, it was very important that Mendel generated a lot of data by making numerous genetic crosses, so that he could begin to note these patterns in offspring ratios.
Dihybrid Cross
Mendel continued his experimentation by observing the resulting offspring when two traits were considered at a time. These two trait crosses, called dihybrid crosses, were more complex, yielding 9:3:3:1 phenotypic ratios (Figure 6).
For example, at the P generation, Mendel crossed true breeding pea plants that had green (G), inflated (smooth)(R) pods (genotype: GGRR) with true breeding plants that had yellow (g), constricted (bumpy) (r) pods (genotype: ggrr) to produce hybrid offspring (genotype: GgRr) in the F1 generation. Crossing these hybrid offspring (GgRr x GgRr), as shown in figure 5.6, would provide data on the probable phenotypic and genotypic ratios of this dihybrid cross.
The offspring of this particular cross (GgRr x GgRr) is predicted to produce offspring in the following ratios, as shown by counting the offspring in the inner boxes of the Punnett square in Figure 6:
Probable Genotypic Ratios of Offspring Resulting from Dihybrid Cross
1GGRR : 1GGrr : 2GGRr : 2GgRR : 4GgRr : 2Ggrr : 2ggRr : 1ggRR : 1ggrr
Probable Phenotypic Ratios of Offspring Resulting from Dihybrid Cross
9 green, inflated : 3 green, constricted : 3 yellow, inflated : 1 yellow, constricted
Note that although these are the predicted genotypic and phenotypic ratios of offspring, actual ratios will vary somewhat from this. Again, it was very important that Mendel bred many plants and generated a great deal of data on offspring, so that he was able to note these patterns in offspring ratios.

Figure 6. Dihybrid Punnett square illustrating probable offspring ratio from parent pea plants that were heterozygous for both pod color and pod shape. (Credit: Wikimedia Commons)
6.3 Non-Mendelian Genetics – Incomplete Dominance, Codominance, Multiple Alleles, & Polygenes
During Mendel’s time, people believed in the concept of “blending inheritance”, whereby offspring demonstrated intermediate phenotypes between those of the parental generation (a mix of traits). This was refuted by Mendel’s pea plant experiments that illustrated the Principle of Dominance and Recessiveness. But certain genes do act in a way that is described as “non-mendelian”, because neither allele is dominant or recessive. These non-Mendelian patterns of inheritance include:
Incomplete Dominance
Perhaps the most obvious example of this difference from classic “Mendelian genetics” is a genetic phenomena called incomplete dominance. This mixing of traits superficially resembles the former idea of blending inheritance, but can still be explained using Mendel’s principles, with some important modifications. With incomplete dominance, alleles do not exert full dominance, but are expressed, so that the offspring resemble a mixture of the two phenotypes.
Probably the most thoroughly studied two allele system that exhibits incomplete dominance is found in the flower color of snapdragon plants (Figure 7). The alleles that give rise to flower coloration (Red or White) are both expressed in plants with the heterozygous genotype, so that when both alleles are present, the snapdragon yields pink flowers. The alleles for the flower color gene that express incomplete dominance are often written with capitals denoting their effect, such as R for red and W for white, since neither gene is recessive. In the following diagram the incompletely dominant alleles are denoted as superscripts of F, which stands for flower color.
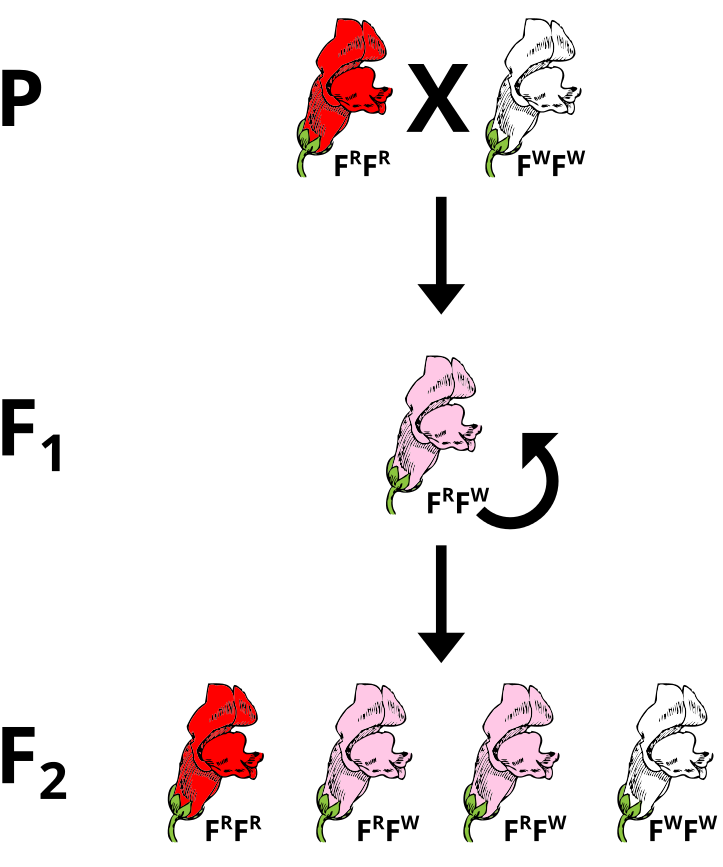
Figure 7. Incomplete Dominance in the Snapdragon Flower. Note that the genotype RR creates a red flower, while WW is responsible for white flowers. The non-mendelian feature is expressed in the pink flowers, which gain that color by a mix of the pigments produced by the expression of both the red and white alleles. (Credit: Wikimedia Commons)
Codominance
Codominance is somewhat similar to incomplete dominance, because both alleles for a gene are expressed, but it occurs when the effect of two different alleles are not necessarily mixed together, but instead show their effects independently. This phenomena is also described as non-mendelian, because neither allele is dominant or recessive.
For example, when a cow with a gene for brown fur mates with a bull with a gene for white fur, both genes can be expressed in the offspring. But instead of a mixed color offspring, the calf has patches of white fur and patches of brown fur as shown in figure 8.
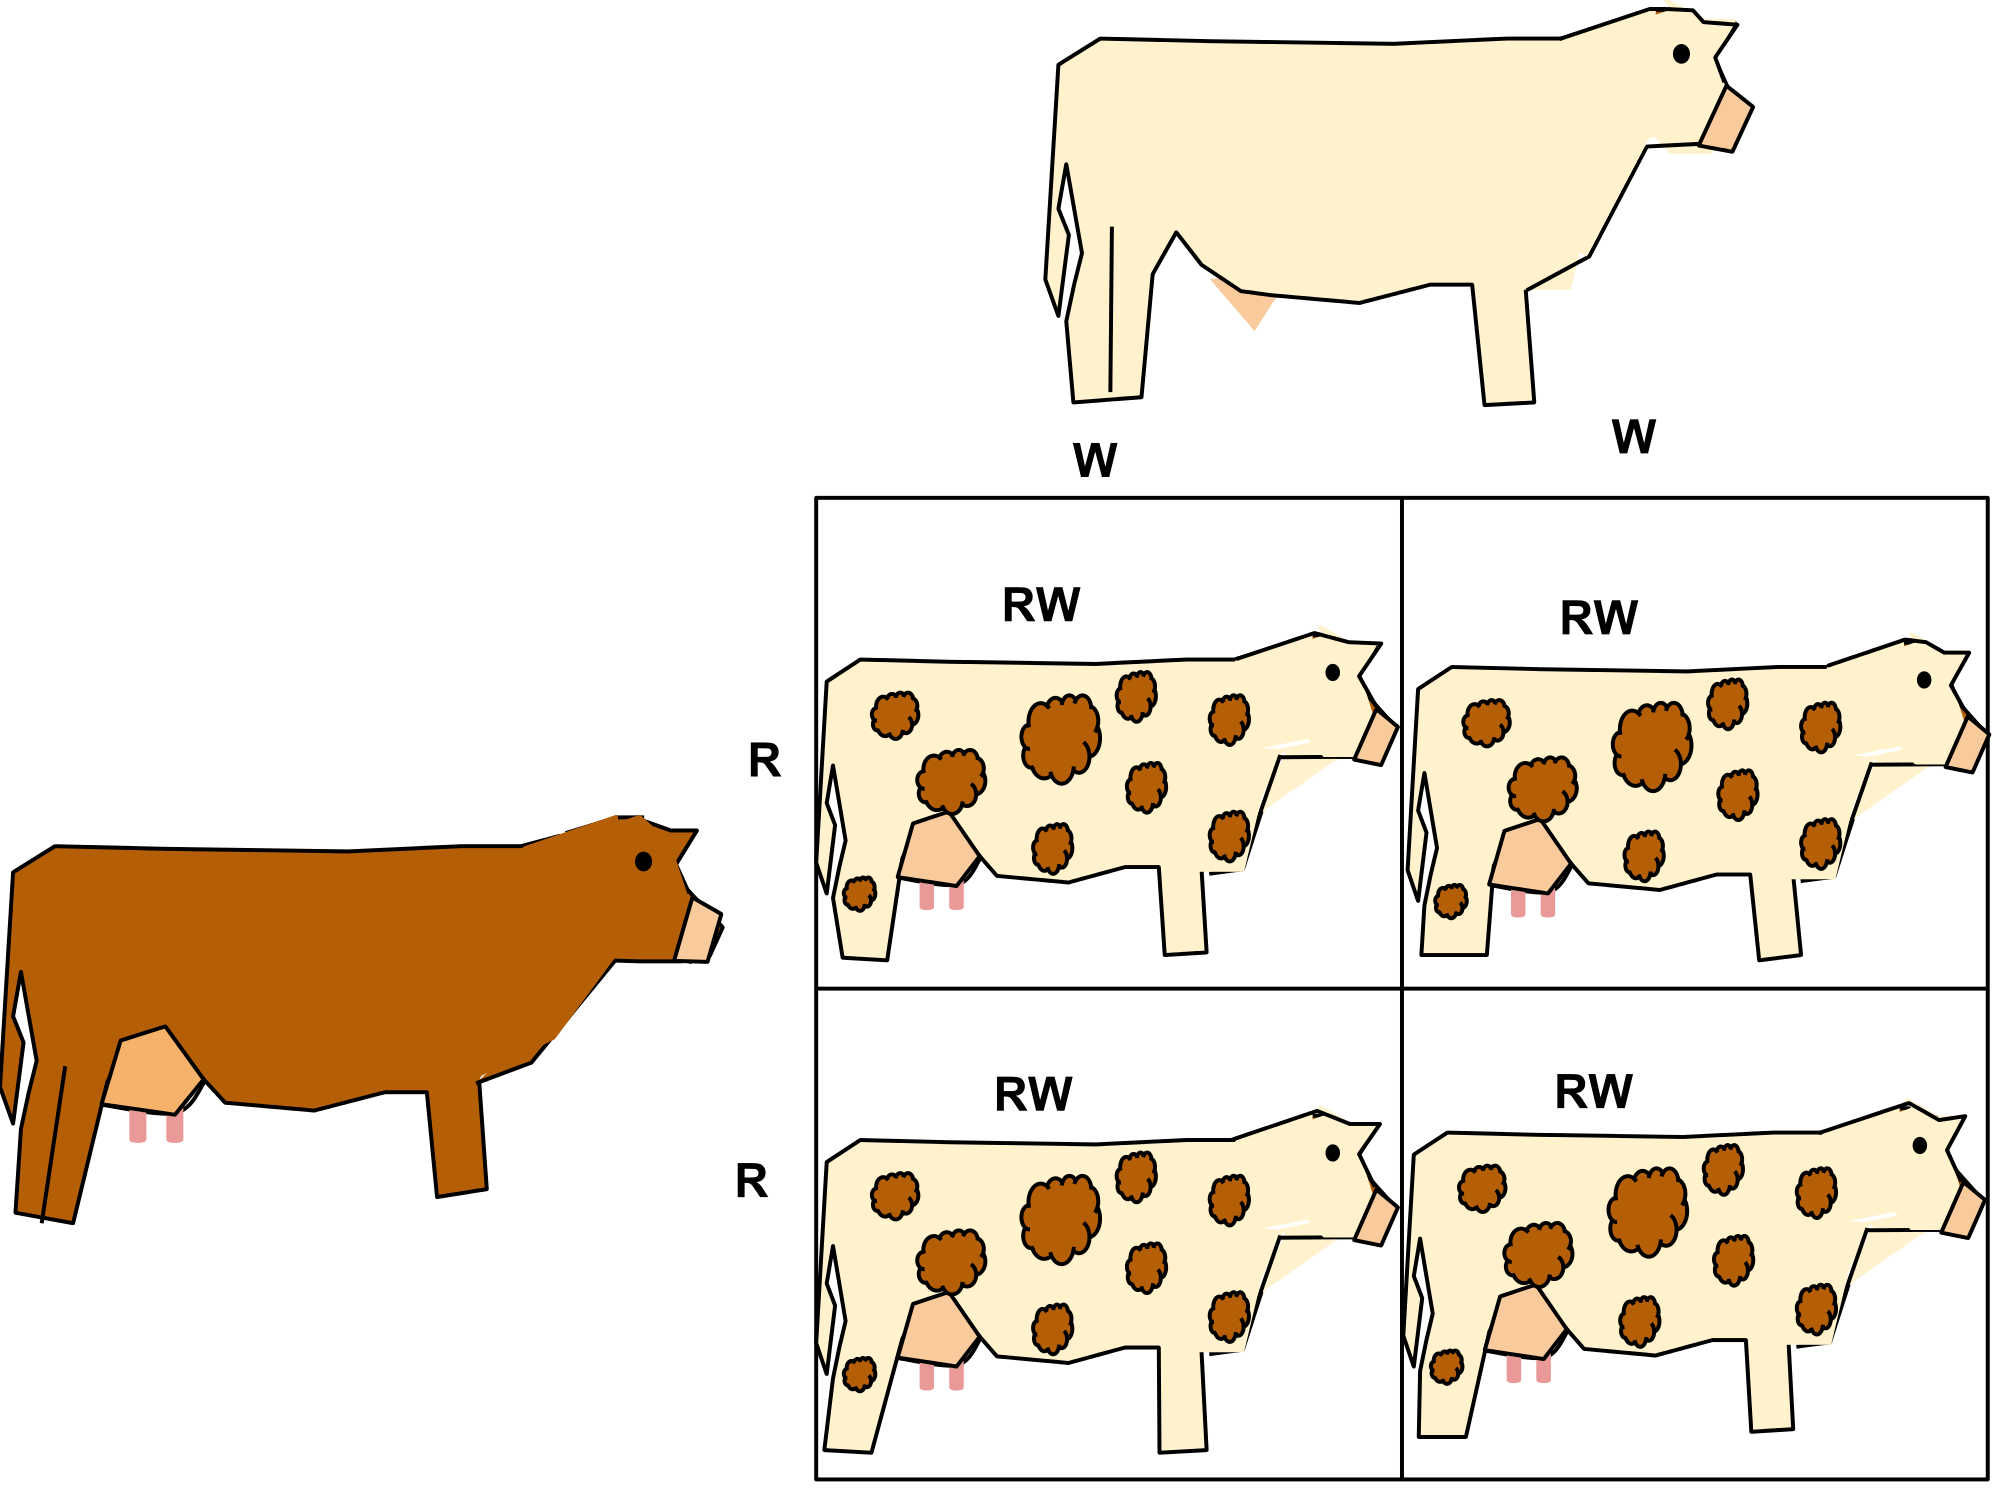
Figure 8. Images demonstrating codominance with the example of brown and white cows breeding and producing calves with brown and white spots on their fur. (Credit: “Co-dominance in Roan Cattle” by Hhughes15 is licensed under CC BY 4.0)
Multiple Alleles – Traits Controlled by more than Two Alleles
Mendel noted that there were two alleles for every gene for each of the pea plant traits. But since Mendel’s time, traits have been discovered that have more than two alleles for one characteristic. Of course each individual still only has two alleles for the trait – one gained from the father and one from the mother – but more than two alleles exist in the population. A well studied example of multiple alleles are the three alleles for blood type found in humans, A, B, or O.
The A allele and B allele are codominant to each other, and both are dominant over the O allele (Figure 9). Therefore, if an individual inherits two copies of the A allele (genotype AA), or one copy of the A allele and one copy of the O allele (genotype Ao), the individual will have type A blood as their phenotype. If an individual inherits two copies of the B allele (genotype BB) or one copy of the B allele and one copy of the O allele (genotype Bo), the individual will have type B blood as their phenotype. If an individual inherits one copy of the A allele and one copy of the B allele (genotype AB), then the individual will have type AB blood as their phenotype, showing codominance. Only individuals who inherit two copies of the O allele (genotype OO) will have type O blood as their phenotype. See an example of this type of mixed inheritance in Figure 10. Since three alleles exist (A, B, and O), rather than two alleles described by Mendel, and the AB blood group shows codominance, this phenomena is also described as non-mendelian.

Figure 9. Multiple Alleles for Human Blood Type (A, B, & O). The results shown above show four possible phenotypes, the blood types: A, B, O and the blended AB. (Credit: Wikimedia Commons)
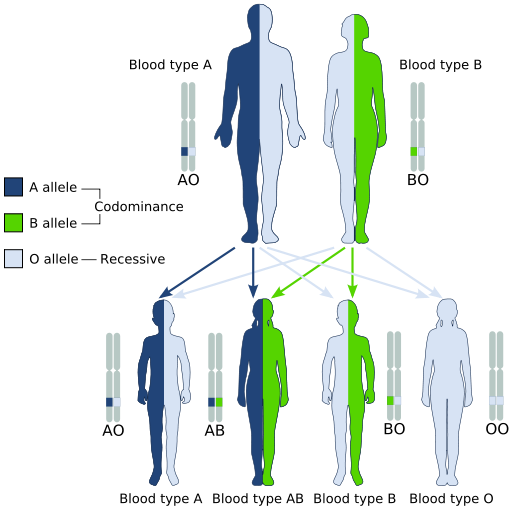
Figure 10. Diagram showing possible offspring from a cross of male with blood type A and the genotype AO, and a female with blood type B and the genotype BO, which shows that their children could have any of the four known A, B, O blood types. (Credit: Wikimedia Commons)
Polygenic Inheritance
Learning about genetics can sometimes be frustrating, especially when referring to human traits, because very few human traits (about 13%) follow Mendel’s straightforward rules on inheritance. In addition to the non-mendelian patterns of inheritance discussed previously in this chapter, many traits are determined by the effects of multiple genes interacting with each other. These traits are known as polygenic (many genes), and the traits controlled by these genes are described in terms of polygenetic inheritance.
A good example of polygenic inheritance can be noted in the human trait of skin color. Unlike a simple Mendelian characteristic, human skin color displays continuous variation. Mendel’s pea plants had either purple flowers or white flowers, but humans do not come in discrete skin color categories. In fact, humans can demonstrate an almost infinite number of different skin colors (figure 11).

Figure 11. Chart showing how multiple genes influence the development of human skin color. (Credit: “Human Skin Color Chart and Histogram” by CKRobinson is licensed under CC BY 4.0)
When there are large numbers of genes involved, it becomes difficult to distinguish the effect of each individual gene, and even harder to see that gene variants (alleles) are inherited according to Mendelian rules. As an additional complication, skin color does not just depend on genetics: it also depends on environmental factors. For example, when exposed to UV radiation from the Sun or a tanning bed, the skin produces additional melanin pigment, resulting in the development of darker skin, which is also known as getting a tan. Other traits that show continuous variation are also caused by polygenic alleles and include weight, intelligence, skin color, and eye color.
The following video by the “Amoeba Sisters” helps illustrate the non-Mendellian ideas presented above:
Amoeba Sisters (2015, May 25) Incomplete Dominance, Codominance, Polygenic Traits, and Epistasis. [Video – YouTube] https://youtu.be/YJHGfbW55l0
6.4 Environmental Effects on Phenotype (Epigenetics)
Phenotypes also vary because they are affected by the environment, a phenomenon called epigenetics. For instance, a person may have a genetic tendency to be underweight or obese, but his or her actual weight will depend on diet and exercise (with these factors often playing a greater role than genes). A person may have genes that would produce a high IQ brain, but if that person had a poor diet as a child, or is brought up in an environment deficient in positive stimulation and learning opportunities, he or she may have a lower IQ than someone with genes for a less intelligent brain. In another example, your hair color may depend on your genes—until you dye your hair purple!
One striking example of how environment can affect phenotype comes from the hereditary disorder phenylketonuria (PKU). People who are homozygous for disease alleles of the PKU gene lack activity of an enzyme that breaks down the amino acid phenylalanine. Because people with this disorder cannot get rid of excess phenylalanine, it rapidly builds up to toxic levels in their bodies. If PKU is not treated, the extra phenylalanine can keep the brain from developing normally, leading to intellectual disability, seizures, and mood disorders. However, because PKU is caused by the buildup of too much phenylalanine, it can also be treated in a very simple way: by giving affected babies and children a diet low in phenylalanine. If people with phenylketonuria follow this diet strictly from a very young age, they can avoid developing symptoms of this disorder. In many countries, all newborns are screened for PKU and similar genetic diseases soon after birth through a simple blood test.
The following two videos help to describe the concept of environmental effects on phenotype:
Khan Academy (2019, March 20) Phenotype Plasticity – Heredity.[Video – YouTube] https://youtu.be/Mh3QXbVU6Eo
Pathwayz – Bozeman Science (2014, Nov 5). Genetics – Environmental influences (Epigenetics). [Video – YouTube] https://youtu.be/i9a-ru2ES6Y
6.5 Epistasis and the Influence of Genes on other Genes
Chromosomes are made up of genes, which control traits. A particular location along a chromosome is called a locus (plural = loci), and genes are described as being located at a set locus on the chromosome. More recently, studies have shown that genes do not exist in isolation and that gene products can interact with each other in some way. Epistasis refers to the phenomenon where a gene at one locus is dependent on the expression of a gene at another locus. Stated another way, one locus acts as a modifier to another gene locus (figure 12).

Figure 12. The interplay of multiple enzymes in a biochemical pathway will alter the phenotype. Some genes will modify the actions of another gene. (Credit: “Epistasis and Modifier Genes” by Jeremy Seto is in the Public Domain, CC0)
This can be visualized in the case of Labrador Retriever fur coloration where three primary coat colors exist; there are black labs, chocolate labs, and yellow labs. Two genes are involved in the coloration of Labradors. The first is a gene for a protein called TYRP1, which is found in pigment storing organelles, called melanosomes. The functioning TYRP1 allele can be identified as “B”. Mutations to this allele have been identified that reduce the function of the pigment protein, which results in a lighter coloration. The mutated alleles can be identified as “b”. A homozygous dominant (BB) or a heterozygous (Bb) dog will be black coated while a homozygous recessive (bb) dog will be brown (chocolate) (figure 13).

Figure 13. Chocolate lab (top), Black lab (middle), Yellow lab (bottom) coat colorations arise from the interaction of 2 gene loci, each with 2 alleles. (Credit: “3labradorcols” by Erikeltic is licensed under CC BY-SA 3.0)
The second gene related to labrador retriever coat color is tied to the gene for the Melanocortin 1 Receptor (MC1R) and influences the expression of the eumelanin pigment in the fur. This gene has the alleles denoted “E” for the normal expression of this gene and “e“ for the lack of expression of this gene. Dogs that are homozygous dominant (EE) or heterozygous (Ee) for the MC1R gene will exhibit the color determined by the genotype of the TYRP1 gene. Homozygous dominant (BB) and heterozygous dogs (Bb) will be black and homozygous recessive (bb) dogs will be brown/chocolate, as mentioned in the previous paragraph. However, dogs that are homozygous recessive for the MC1R gene (ee) will not exhibit the black or brown coloration, regardless of what the dog’s genotype is for the TYRP1 gene, resulting in the yellow Labrador coloration. Therefore, a yellow Labrador retriever could have any of the following genotypes: BBee Bbee, or bbee(figure 14).
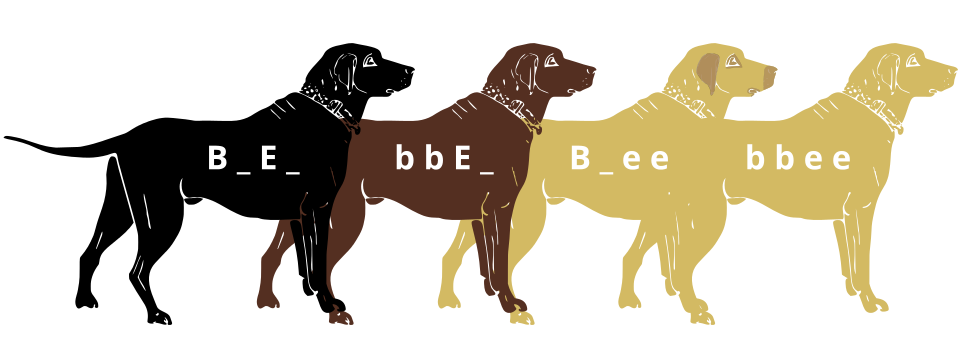
Figure 14. The image above shows how the interplay between the TYRP1 and MC1R genes found on two different loci determines the coat coloration of labrador retrievers. (Credit: “Black lab (B_E_, Chocolate lab (bbE_), Yellow lab with dark skin where exposed (B _ee) and Yellow lab with light skin where exposed.” by Jeremy Seto is licensed under CC BY-SA 3.0)
It may be easier to think of the interplay of these two genes in the following way. The MC1R gene determines whether the lab will have color in its fur (black/brown pigment) or not (yellow). If the MC1R gene dictates that pigment will be present, then the TYRP1 gene determines how much of the pigment will be present, with more pigment resulting in black labs and less pigment resulting in brown (chocolate) dogs.
6.6 Future of Genetics
Our understanding of genetics is changing all the time, as new technologies allow us to delve into the complexity of the genomes of various individuals and populations. The role of genetics in human health and disease is a focus of both university and industrial research, as new understandings allow for better diagnoses, treatments and even cures. Genetic screening of endangered species housed in zoos may allow for better matches between potential mates, to avoid inbreeding and maintain genetic diversity as much as possible. Genetically modified organisms, both plant and animal, may allow for new ways to feed our ever growing human population. Genetics is an exciting and evolving field that may provide answers to some of our planet’s most vexing challenges, with new discoveries occurring every year!
The following video from the National Human Genome Research Institute gives some predictions of what the future of genetics may reveal:
National Human Genome Research Institute (2020,Oct 28). The future of genomics: 10 bold predictions. [Video – YouTube] https://youtu.be/5kAL11m_fwM
Attribution:
Content in this chapter includes original work created by Lauren Roberts and Paul Bosch as well as from the following sources, with some modifications:
“Biology, 2nd edition” by OpenStax is licensed under CC BY 4.0 / A derivative from the original work
“Genetics” by Jeremy Seto is licensed under CC BY-NC-SA 4.0 / A derivative from the original work

