
1 Chapter 1: Introduction to Statistics
What are statistics?
Statistics include numerical facts and figures. For instance:
- The largest earthquake measured 9.2 on the Richter scale.
- Men are at least 10 times more likely than women to commit murder.
- One in every 8 South Africans is HIV positive.
- By the year 2020, there will be 15 people aged 65 and over for every new baby born.
The study of statistics involves math and relies upon calculations of numbers. But it also relies heavily on how the numbers are chosen and how the statistics are interpreted.
Statistical reasoning involves how numbers are chosen and how statistics are interpreted. Consider the following three scenarios and the interpretations based upon the presented statistics. You will find that the numbers may be right, but the interpretation may be wrong.
Try to identify a major flaw with each interpretation before we describe it.
- A new advertisement for Ben and Jerry’s ice cream introduced in late May of last year resulted in a 30% increase in ice cream sales for the following three months. Thus, the advertisement was effective.
- The more churches in a city, the more crime there is. Thus, churches lead to crime.
- 75% more interracial marriages are occurring this year than 25 years ago. Thus, our society accepts interracial marriages.
What did you come up with?
- A new advertisement for Ben and Jerry’s ice cream introduced in late May of last year resulted in a 30% increase in ice cream sales for the following three months. Thus, the advertisement was effective. A major flaw is that ice cream consumption generally increases in the months of June, July, and August regardless of advertisements. This effect is called a history effect and leads people to interpret outcomes as the result of one variable when another variable (in this case, one having to do with the passage of time) is actually responsible.
- The more churches in a city, the more crime there is. Thus, churches lead to crime. A major flaw is that both increased churches and increased crime rates can be explained by larger populations. In bigger cities, there are both more churches and more crime. This problem, which we will discuss in more detail in unit 2, refers to the third-variable problem. Namely, a third variable can cause both situations; however, people erroneously believe that there is a causal relationship between the two primary variables rather than recognize that a third variable can cause both.
- 75% more interracial marriages are occurring this year than 25 years ago. Thus, our society accepts interracial marriages. A major flaw is that we don’t have the information that we need. What is the rate at which marriages are occurring? Suppose only 1% of marriages 25 years ago were interracial and so now 1.75% of marriages are interracial (1.75 is 75% higher than 1). But this latter number is hardly evidence suggesting the acceptability of interracial marriages. In addition, the statistic provided does not rule out the possibility that the number of interracial marriages has seen dramatic fluctuations over the years and this year is not the highest. Again, there is simply not enough information to understand fully the impact of the statistics.
As a whole, the three examples above show that statistics are not only facts and figures; they are something more than that-they are numbers measured for some purpose. In the broadest sense, “statistics” refers to a range of techniques and procedures for analyzing, interpreting, displaying, and making decisions based on data.
Statistics is the language of science and data. The ability to understand and communicate using statistics enables researchers from different labs, different languages, and different fields to articulate to one another exactly what they have found in their work. It is an objective, precise, and powerful tool in science and in everyday life.
What statistics are not.
Many psychology, social science, and nursing students dread the idea of taking a statistics course, and more than a few have changed majors upon learning that it is a requirement. That is because many students view statistics as a math class, which is actually not true. While many of you will not believe this or agree with it, statistics isn’t math. Although math is a central component of it, statistics is a broader way of organizing, interpreting, and communicating information in an objective manner. Indeed, great care has been taken to eliminate as much math from this course as possible. Statistics is a way of viewing reality as it exists around us in a way that we otherwise could not.
Why do we study statistics?
Virtually every student of the behavioral sciences takes some form of statistics class. This is because statistics is how we communicate in science. It serves as the link between a research idea and usable conclusions. Without statistics, we would be unable to interpret the massive amounts of information contained in data. Even small datasets contain hundreds – if not thousands – of numbers, each representing a specific observation we made. Without a way to organize these numbers into a more interpretable form, we would be lost, having wasted the time and money of our participants, ourselves, and the communities we serve.
Beyond its use in science, however, there is a more personal reason to study statistics. Like most people, you probably feel that it is important to “take control of your life.” But what does this mean? Partly, it means being able to properly evaluate the data and claims that bombard you every day. If you cannot distinguish good from faulty reasoning, then you are vulnerable to manipulation and to decisions that are not in your best interest. Statistics provides tools that you need in order to react intelligently to information you hear or read. In this sense, statistics is one of the most important things that you can study.
To be more specific, here are some claims that we have heard on several occasions. (We are not saying that each one of these claims is true!)
- 4 out of 5 dentists recommend Dentine.
- Almost 85% of lung cancers in men and 45% in women are tobacco-related.
- Condoms are effective 94% of the time.
- People tend to be more persuasive when they look others directly in the eye and speak loudly and quickly.
- Women make 75 cents to every dollar a man makes when they work the same job.
- A surprising new study shows that eating egg whites can increase one’s life span.
- People predict that it is very unlikely there will ever be another baseball player with a batting average over 400.
- There is an 80% chance that in a room full of 30 people that at least two people will share the same birthday.
- 79.48% of all statistics are made up on the spot.
All of these claims are statistical in character. We suspect that some of them sound familiar; if not, we bet that you have heard other claims like them. Notice how diverse the examples are. They come from psychology, health, law, sports, business, etc. Indeed, data and data interpretation show up in discourse from virtually every facet of contemporary life.
Statistics are often presented in an effort to add credibility to an argument or advice. You can see this by paying attention to advertisements. Many of the numbers thrown about in this way do not represent careful statistical analysis. They can be misleading and push you into decisions that you might find cause to regret. For these reasons, learning about statistics is a long step towards taking control of your life. (It is not, of course, the only step needed for this purpose.) The purpose of this course is to help you learn statistical essentials and help prepare you for a career in psychology, nursing, counseling, physical therapy, occupational therapy, or other fields that use evidence-based decision making. Most importantly, taking this course will make you into an intelligent consumer of statistical claims.
You can take the first step right away. To be an intelligent consumer of statistics, your first reflex must be to question the statistics that you encounter. The British Prime Minister Benjamin Disraeli is quoted by Mark Twain as having said, “There are three kinds of lies — lies, damned lies, and statistics.” This quote reminds us why it is so important to understand statistics. So let us invite you to reform your statistical habits from now on. No longer will you blindly accept numbers or findings. Instead, you will begin to think about the numbers, their sources, and most importantly, the procedures used to generate them.
The above section puts an emphasis on defending ourselves against fraudulent claims wrapped up as statistics, but let us look at a more positive note. Just as important as detecting the deceptive use of statistics is the appreciation of the proper use of statistics. You must also learn to recognize statistical evidence that supports a stated conclusion. Statistics are all around you, sometimes used well, sometimes not. We must learn how to distinguish the two cases. In doing so, statistics might be the course you use most in your day to day life, even if you do not ever run a formal analysis again. You will use statistical thinking!
What is statistical thinking?
“Statistical thinking will one day be as necessary for efficient citizenship as the ability to read and write.” – H.G. Wells
Statistical thinking is a way of understanding a complex world by describing it in relatively simple terms that nonetheless capture essential aspects of its structure or function, and that also provide us some idea of how uncertain we are about that knowledge. The foundations of statistical thinking come primarily from mathematics and statistics, but also from computer science, psychology, and other fields of study.
We can distinguish statistical thinking from other forms of thinking that are less likely to describe the world accurately. In particular, human intuition often tries to answer the same questions that we can answer using statistical thinking, but often gets the answer wrong. For example, in recent years most Americans have reported that they think that violent crime was worse compared to the previous year (Pew Research Center). However, a statistical analysis of the actual crime data shows that in fact violent crime has steadily decreased since the 1990’s. Intuition fails us because we rely upon best guesses (which psychologists refer to as heuristics) that can often get it wrong. For example, humans often judge the prevalence of some event (like violent crime) using an availability heuristic – that is, how easily can we think of an example of violent crime. For this reason, our judgments of increasing crime rates may be more reflective of increasing news coverage, in spite of an actual decrease in the rate of crime. Statistical thinking provides us with the tools to more accurately understand the world and overcome the biases of human judgment
Dealing with statistics anxiety
Many people come to their first statistics class with a lot of trepidation and anxiety. Learning statistics, like learning in general, takes knowledgeable teachers, willing students, and, most importantly, a great deal of time and practice. Learning statistics is like learning a language. The symbols and notation make up the rules of grammar and the terminology is the vocabulary. Doing the homework is like practicing the conversation of statistics. Becoming fluent (and staying fluent) in statistics requires practice and continuous use.
Questionnaires can be used to survey students prior to the first class in order to measure their attitude towards statistics, asking them to rate a number of statements on a scale of 1 (strongly disagree) to 7 (strongly agree). One of the items on the statistical attitudes survey is “The thought of being enrolled in a statistics course makes me nervous”. In a recent class, almost two-thirds of the class responded with a five or higher, and about one-fourth of the students said that they strongly agreed with the statement. So if you feel nervous about starting to learn statistics, you are not alone.
Anxiety feels uncomfortable, but psychology tells us that some emotional arousal can actually help us perform better on some tasks, by focusing our attention. So if you start to feel anxious about the material in this book, remind yourself that many other students are feeling similarly, and that this emotional arousal could actually help you learn the material better (even if it doesn’t seem like it!).
Tips for Statistics Anxiety 1. Learn stress management and relaxation techniques.
Techniques such as deep breathing and meditation that help you to relax in any stressful situation can also be helpful when dealing with the nervousness and tension that affect students with math anxiety.
2. Combat negative thinking.
Lack of confidence can be a major impediment for students with math anxiety. Replace those negative thoughts (“I can’t do this”, “I’ve never been good at math”, “I won’t finish in time”) with confidence-building affirmations (“I know this”, “I’m prepared”, “I can do this”).
3. Visualize yourself succeeding.
Athletes use the technique of “visualization” to prepare for major competitions. Imagine yourself being relaxed doing math and during a test and confidently solving the problems.
4. Do “easiest” problems first.
Build up your confidence by first doing those problems in an assignment or on a test that you “know” best. It’ll help you relax when you tackle the “harder” stuff.
5. Channel your stress into something else.
Free up your mind by relieving some of your physical responses to stress. Get up and run around the hall for a minute before the test or squeeze a stress ball like crazy during the test.
6. Start preparing early.
If you try to “cram” the material quickly, you are likely to forget it quickly too. If you practice the
material over a period of time, you will have a better understanding of it and are less likely to forget it when under stress.
7. Take care of yourself.
Although it’s not easy when you’re in school, eating and sleeping well helps your body and mind function to their fullest potential.
8. Try to understand the “why” of statistical concepts rather than memorizing them.
The first thing to go when you are under stress is your short-term memory. This is one reason it is so important to understand that math is not just a set of rules that you have to memorize but that each concept builds on what came before. If you understand the reason behind the rules, you will remember the concepts better and be able to apply them in many different types of problems (not just ones you’ve seen before).
9. Reward yourself for hard work.
After completing a difficult assignment or an exam, it’s time to give yourself a break.
What can statistics do for us?
There are three major things that we can do with statistics:
- Describe: The world is complex and we often need to describe it in a simplified way that we can understand.
- Decide: We often need to make decisions based on data, usually in the face of uncertainty.
- Predict: We often wish to make predictions about new situations based on our knowledge of previous situations.
Let’s look at an example of these in action, centered on a question that many of us are interested in: How do we decide what’s healthy to eat? There are many different sources of guidance; government dietary guidelines, diet books, and bloggers, just to name a few. Let’s focus in on a specific question: Is saturated fat in our diet a bad thing?
One way that we might answer this question is common sense. If we eat fat, then it’s going to turn straight into fat in our bodies, right? And we have all seen photos of arteries clogged with fat, so eating fat is going to clog our arteries, right?
Another way that we might answer this question is by listening to authority figures. The Dietary Guidelines from the US Food and Drug Administration have as one of their Key Recommendations that “A healthy eating pattern limits saturated fats”. You might hope that these guidelines would be based on good science, and in some cases they are, but as Nina Teicholz outlined in her book “Big Fat Surprise”(Teicholz 2014), this particular recommendation seems to be based more on the longstanding dogma of nutrition researchers than on actual evidence.
Finally, we might look at actual scientific research. Let’s start by looking at a large study called the PURE (Prospective Urban Rural Epidemiology) study, which has examined diets and health outcomes (including death) in more than 135,000 people from 18 different countries. In one of the analyses of this dataset (published in The Lancet in 2017; Dehghan et al. (2017)), the PURE investigators reported an analysis of how intake of various classes of macronutrients (including saturated fats and carbohydrates) was related to the likelihood of dying during the time that people were followed. People were followed for a median of 7.4 years, meaning that half of the people in the study were followed for less and half were followed for more than 7.4 years. Figure 1 plots some of the data from the study (extracted from the paper), showing the relationship between the intake of both saturated fats and carbohydrates and the risk of dying from any cause.
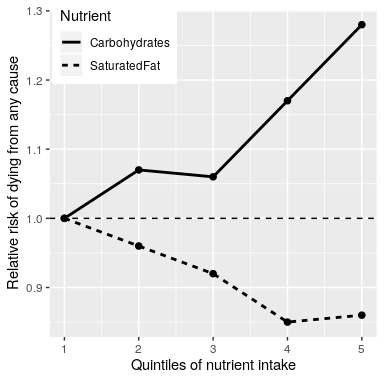
Figure 1: A plot of data from the PURE study, showing the relationship between death from any cause and the relative intake of saturated fats and carbohydrates.
This plot is based on ten numbers. To obtain these numbers, the researchers split the group of 135,335 study participants (which we call the “sample”) into 5 groups (“quintiles”) after ordering them in terms of their intake of either of the nutrients; the first quintile contains the 20% of people with the lowest intake, and the 5th quintile contains the 20% with the highest intake.
The researchers then computed how often people in each of those groups died during the time they were being followed. The figure expresses this in terms of the relative risk of dying in comparison to the lowest quintile: If this number is greater than one, it means that people in the group are more likely to die than are people in the lowest quintile, whereas if it’s less than one, it means that people in the group are less likely to die. Figure 1.1 is pretty clear: People who ate more saturated fat were less likely to die during the study, with the lowest death rate seen for people who were in the fourth quintile (that is, who ate more fat than the lowest 60% but less than the top 20%). The opposite is seen for carbohydrates; the more carbs a person ate, the more likely they were to die during the study. This example shows how we can use statistics to describe a complex dataset in terms of a much simpler set of numbers; if we had to look at the data from each of the study participants at the same time, we would be overloaded with data and it would be hard to see the pattern that emerges when they are described more simply.
The numbers in Figure 1 seem to show that deaths decrease with saturated fat and increase with carbohydrate intake. This large-scale study also had some methodological challenges controlling for socioeconomic factors and measurement of dietary intake data. We also know that there is a lot of uncertainty in the data; there are some people who died early even though they ate a low-carb diet, and, similarly, some people who ate a ton of carbs but lived to a ripe old age. Given this variability, we want to decide whether the relationships that we see in the data are large enough that we wouldn’t expect them to occur randomly if there was not truly a relationship between diet and longevity. Statistics provide us with the tools to make these kinds of decisions. But as we will see throughout the book, this need for black-and-white decisions based on fuzzy evidence can lead researchers astray.
Based on the data we would also like to make predictions about future outcomes. For example, a life insurance company might want to use data about a particular person’s intake of fat and carbohydrate to predict how long they are likely to live. An important aspect of prediction is that it requires us to generalize from the data we already have to some other situation, often in the future; if our conclusions were limited to the specific people in the study at a particular time, then the study would not be very useful. In general, researchers must assume that their particular sample is representative of a larger population, which requires that they obtain the sample in a way that provides an unbiased picture of the population. For example, if the PURE study had recruited all of its participants from religious sects that practice vegetarianism, then we probably wouldn’t want to generalize the results to people who follow different dietary standards.
The big ideas of statistics
One way to think of statistics is as a set of tools that enable us to learn from data.
There are two main branches of statistical analysis, descriptive statistics and inferential statistics.
- Statistics that are used to organize and summarize the information so that the researcher can see what happened during the research study and can also communicate the results to others are called descriptive statistics. The first unit of the book is focused on descriptive statistics.
- Statistics that help the researcher to answer the general research question by determining exactly what conclusions are justified based on the results that were obtained are referred to as inferential statistics.
Statistics provides us with the tools to characterize uncertainty, to make decisions under uncertainty, and to make predictions whose uncertainty we can quantify. For example, we now know that cigarette smoking causes lung cancer, but this causation is probabilistic: A 68-year-old man who smoked two packs a day for the past 50 years and continues to smoke has a 15% (1 out of 7) risk of getting lung cancer, which is much higher than the chance of lung cancer in a nonsmoker. However, it also means that there will be many people who smoke their entire lives and never get lung cancer.
One often sees journalists write that scientific researchers have “proven” some hypothesis. But statistical analysis can never “prove” a hypothesis, in the sense of demonstrating that it must be true (as one would in a logical or mathematical proof). Statistics can provide us with evidence, but it’s always tentative and subject to the uncertainty that is always present in the real world.
The concept of aggregation implies that we can make useful insights by collapsing across data – but how much data do we need? The idea of sampling says that we can summarize an entire population based on just a small number of samples from the population, as long as those samples are obtained in the right way. As we already discussed above, the way that the study sample is obtained is critical, as it determines how broadly we can generalize the results. Another fundamental insight about sampling is that while larger samples are always better (in terms of their ability to accurately represent the entire population), there are diminishing returns as the sample gets larger. In fact, the rate at which the benefit of larger samples decreases follows a simple mathematical rule, growing as the square root of the sample size, such that in order to double the precision of our estimate we need to quadruple the size of our sample.
Study design is also important part of statistical thinking — remember correlation and causation. Any introduction to psychology course and introductory statistics will often teach that “correlation does not imply causation”, though the renowned data visualization expert Edward Tufte has added, “but it sure is a hint.”
We will examine more about study design and types of data in our next chapter!
Learning Objectives
- Define statistical thinking and why we use statistics.
- Practice ways to reduce statistical anxiety.
- Identify how statistical techniques fit into the general process of science.
Exercises – Chapter 1
- Reflect on a statistics that you have encountered in daily life. How can you apply statistical thinking?
- What are two reasons that you identified for why taking a course in statistics is important?
- How would you define statistics to a friend, neighbor, family member? Define statistics from what you have learned so far.
- Review the tips for statistical anxiety and reflect on how you can implement at least one tip to help you succeed in the course.
