
19 Chapter 19. Doing reproducible research
Most people think that science is a reliable way to answer questions about the world. When our physician prescribes a treatment we trust that it has been shown to be effective through research, and we have similar faith that the airplanes that we fly in aren’t going to fall from the sky. However, since 2005 there has been an increasing concern that science may not always work as well as we have long thought that it does. In this chapter we will discuss these concerns about reproducibility of scientific research, and outline the steps that one can take to make sure that our statistical results are as reproducible as possible.
How we think science should work
Let’s say that we are interested in a research project on how children choose what to eat. This is a question that was asked in a study by the well-known eating researcher Brian Wansink and his colleagues in 2012. The standard (and, as we will see, somewhat naive) view goes something like this:
- You start with a hypothesis
- Branding with popular characters should cause children to choose “healthy” food more often
- You collect some data
- Offer children the choice between a cookie and an apple with either an Elmo-branded sticker or a control sticker, and record what they choose
- You do statistics to test the null hypothesis
- “The preplanned comparison shows Elmo-branded apples were associated with an increase in a child’s selection of an apple over a cookie, from 20.7% to 33.8% (χ2\chi^2=5.158; P=.02)” (Wansink, Just, and Payne 2012)
- You make a conclusion based on the data
- “This study suggests that the use of branding or appealing branded characters may benefit healthier foods more than they benefit indulgent, more highly processed foods. Just as attractive names have been shown to increase the selection of healthier foods in school lunchrooms, brands and cartoon characters could do the same with young children.”(Wansink, Just, and Payne 2012)
How science (sometimes) actually works
Brian Wansink is well known for his books on “Mindless Eating”, and his fee for corporate speaking engagements was at one point in the tens of thousands of dollars. In 2017, a set of researchers began to scrutinize some of his published research, starting with a set of papers about how much pizza people ate at a buffet. The researchers asked Wansink to share the data from the studies but he refused, so they dug into his published papers and found a large number of inconsistencies and statistical problems in the papers. The publicity around this analysis led a number of others to dig into Wansink’s past, including obtaining emails between Wansink and his collaborators. As reported by Stephanie Lee at Buzzfeed, these emails showed just how far Wansink’s actual research practices were from the naive model:
…back in September 2008, when Payne was looking over the data soon after it had been collected, he found no strong apples-and-Elmo link — at least not yet. … “I have attached some initial results of the kid study to this message for your report,” Payne wrote to his collaborators. “Do not despair. It looks like stickers on fruit may work (with a bit more wizardry).” … Wansink also acknowledged the paper was weak as he was preparing to submit it to journals. The p-value was 0.06, just shy of the gold standard cutoff of 0.05. It was a “sticking point,” as he put it in a Jan. 7, 2012, email. … “It seems to me it should be lower,” he wrote, attaching a draft. “Do you want to take a look at it and see what you think. If you can get the data, and it needs some tweeking, it would be good to get that one value below .05.” … Later in 2012, the study appeared in the prestigious JAMA Pediatrics, the 0.06 p-value intact. But in September 2017, it was retracted and replaced with a version that listed a p-value of 0.02. And a month later, it was retracted yet again for an entirely different reason: Wansink admitted that the experiment had not been done on 8- to 11-year-olds, as he’d originally claimed, but on preschoolers.
This kind of behavior finally caught up with Wansink; fifteen of his research studies have been retracted and in 2018 he resigned from his faculty position at Cornell University.
The reproducibility crisis in science
While we think that the kind of frauduent behavior seen in Wansink’s case is relatively rare, it has become increasingly clear that problems with reproducibility are much more widespread in science than previously thought. This became particularly evident in 2015, when a large group of researchers published a study in the journal Science titled “Estimating the reproducibility of psychological science”(Open Science Collaboration 2015). In this paper, the researchers took 100 published studies in psychology and attempted to reproduce the results originally reported in the papers. Their findings were shocking: Whereas 97% of the original papers had reported statistically significant findings, only 37% of these effects were statistically significant in the replication study. Although these problems in psychology have received a great deal of attention, they seem to be present in nearly every area of science, from cancer biology (Errington et al. 2014) and chemistry (Baker 2017) to economics (Christensen and Miguel 2016) and the social sciences (Camerer et al. 2018).
The reproducibility crisis that emerged after 2010 was actually predicted by John Ioannidis, a physician from Stanford who wrote a paper in 2005 titled “Why most published research findings are false”(Ioannidis 2005). In this article, Ioannidis argued that the use of null hypothesis statistical testing in the context of modern science will necessarily lead to high levels of false results. Additionally, statistical power remains low in many areas of science (Smaldino and McElreath, 2016), suggesting that many published research findings are false. An amusing example of this was seen in a paper by Jonathan Schoenfeld and John Ioannidis, titled “Is everything we eat associated with cancer? A systematic cookbook review”(Schoenfeld and Ioannidis, 2013). They examined a large number of papers that had assessed the relation between different foods and cancer risk, and found that 80% of ingredients had been associated with either increased or decreased cancer risk. In most of these cases, the statistical evidence was weak, and when the results were combined across studies, the result was null.
Low power
Another kind of error can also occur when statistical power is low: Our estimates of the effect size will be inflated. This phenomenon often goes by the term “winner’s curse”, which comes from economics, where it refers to the fact that for certain types of auctions (where the value is the same for everyone, like a jar of quarters, and the bids are private), the winner is guaranteed to pay more than the good is worth. In science, the winner’s curse refers to the fact that the effect size estimated from a significant result (i.e. a winner) is almost always an overestimate of the true effect size.
We can simulate this in order to see how the estimated effect size for significant results is related to the actual underlying effect size. Let’s generate data for which there is a true effect size of d = 0.2, and estimate the effect size for those results where there is a significant effect detected. The left panel of Figure 20.2 shows that when power is low, the estimated effect size for significant results can be highly inflated compared to the actual effect size.
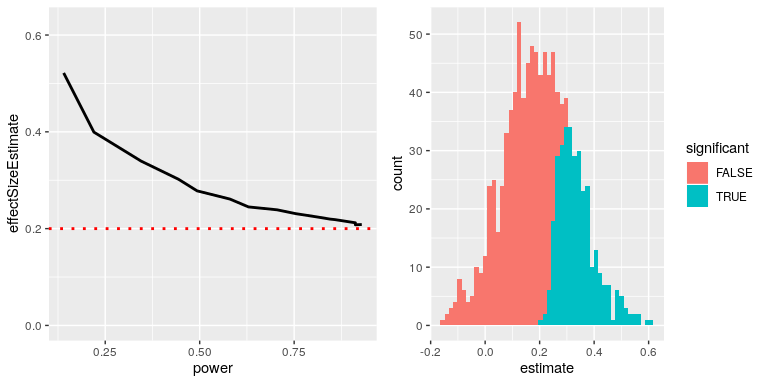
Figure 20.2: Left: A simulation of the winner’s curse as a function of statistical power (x axis). The solid line shows the estimated effect size, and the dotted line shows the actual effect size. Right: A histogram showing effect size estimates for a number of samples from a dataset, with significant results shown in blue and non-significant results in red.
We can look at a single simulation to see why this is the case. In the right panel of Figure 20.2, you can see a histogram of the estimated effect sizes for 1000 samples, separated by whether the test was statistically significant. It should be clear from the figure that if we estimate the effect size only based on significant results, then our estimate will be inflated; only when most results are significant (i.e. power is high and the effect is relatively large) will our estimate come near the actual effect size.
Questionable research practices (QRPs)
A popular book entitled “The Compleat Academic: A Career Guide”, published by the American Psychological Association (Darley, Zanna, and Roediger, 2004), aims to provide aspiring researchers with guidance on how to build a career. In a chapter by well-known social psychologist Daryl Bem titled “Writing the Empirical Journal Article”, Bem provides some suggestions about how to write a research paper. Unfortunately, the practices that he suggests are deeply problematic, and have come to be known as questionable research practices (QRPs).
Which article should you write? There are two possible articles you can write: (1) the article you planned to write when you designed your study or (2) the article that makes the most sense now that you have seen the results. They are rarely the same, and the correct answer is (2).
What Bem suggests here is known as HARKing (Hypothesizing After the Results are Known)(Kerr, 1998). This might seem innocuous, but is problematic because it allows the researcher to re-frame a post-hoc conclusion (which we should take with a grain of salt) as an a priori prediction (in which we would have stronger faith). In essence, it allows the researcher to rewrite their theory based on the facts, rather that using the theory to make predictions and then test them – akin to moving the goalpost so that it ends up wherever the ball goes. It thus becomes very difficult to disconfirm incorrect ideas, since the goalpost can always be moved to match the data. Bem continues:
Analyzing data Examine them from every angle. Analyze the sexes separately. Make up new composite indices. If a datum suggests a new hypothesis, try to find further evidence for it elsewhere in the data. If you see dim traces of interesting patterns, try to reorganize the data to bring them into bolder relief. If there are participants you don’t like, or trials, observers, or interviewers who gave you anomalous results,drop them (temporarily). Go on a fishing expedition for something — anything — interesting. No, this is not immoral.
What Bem suggests here is known as p-hacking, which refers to trying many different analyses until one finds a significant result. Bem is correct that if one were to report every analysis done on the data then this approach would not be “immoral”. However, it is rare to see a paper discuss all of the analyses that were performed on a dataset; rather, papers often only present the analyses that worked – which usually means that they found a statistically significant result. There are many different ways that one might p-hack:
- Analyze data after every subject, and stop collecting data once p<.05
- Analyze many different variables, but only report those with p<.05
- Collect many different experimental conditions, but only report those with p<.05
- Exclude participants to get p<.05
- Transform the data to get p<.05
A well-known paper by Simmons, Nelson, and Simonsohn (2011) showed that the use of these kinds of p-hacking strategies could greatly increase the actual false positive rate, resulting in a high number of false positive results.
ESP or QRP?
In 2011, that same Daryl Bem published an article (Bem, 2011) that claimed to have found scientific evidence for extrasensory perception (ESP). The article states:
This article reports 9 experiments, involving more than 1,000 participants, that test for retroactive influence by “time-reversing” well-established psychological effects so that the individual’s responses are obtained before the putatively causal stimulus events occur. …The mean effect size (d) in psi performance across all 9 experiments was 0.22, and all but one of the experiments yielded statistically significant results.
As researchers began to examine Bem’s article, it became clear that he had engaged in all of the QRPs that he had recommended in the chapter discussed above. As Tal Yarkoni pointed out in a blog post that examined the article:
- Sample sizes varied across studies
- Different studies appear to have been lumped together or split apart
- The studies allow many different hypotheses, and it’s not clear which were planned in advance
- Bem used one-tailed tests even when it’s not clear that there was a directional prediction (so alpha is really 0.1)
- Most of the p-values are very close to 0.05
- It’s not clear how many other studies were run but not reported
Doing reproducible research
In the years since the reproducibility crisis arose, there has been a robust movement to develop tools to help protect the reproducibility of scientific research.
Pre-registration
One of the ideas that has gained the greatest traction is pre-registration, in which one submits a detailed description of a study (including all data analyses) to a trusted repository (such as the Open Science Framework or AsPredicted.org). By specifying one’s plans in detail prior to analyzing the data, pre-registration provides greater faith that the analyses do not suffer from p-hacking or other questionable research practices.
The effects of pre-registration in clinical trials in medicine have been striking. In 2000, the National Heart, Lung, and Blood Institute (NHLBI) began requiring all clinical trials to be pre-registered using the system at ClinicalTrials.gov. This provides a natural experiment to observe the effects of study pre-registration. When Kaplan and Irvin (2015) examined clinical trial outcomes over time, they found that the number of positive outcomes in clinical trials was greatly reduced after 2000 compared to before. While there are many possible causes, it seems likely that prior to study registration researchers were able to change their methods or hypotheses in order to find a positive result, which became more difficult after registration was required.
Reproducible practices
The paper by Simmons, Nelson, and Simonsohn (2011) laid out a set of suggested practices for making research more reproducible, all of which should become standard for researchers:
- Authors must decide the rule for terminating data collection before data collection begins and report this rule in the article.
- Authors must collect at least 20 observations per cell or else provide a compelling cost-of-data-collection justification.
- Authors must list all variables collected in a study.
- Authors must report all experimental conditions, including failed manipulations.
- If observations are eliminated, authors must also report what the statistical results are if those observations are included.
- If an analysis includes a covariate, authors must report the statistical results of the analysis without the covariate.
Replication
One of the hallmarks of science is the idea of replication – that is, other researchers should be able to perform the same study and obtain the same result. Unfortunately, as we saw in the outcome of the Replication Project discussed earlier, many findings are not replicable. The best way to ensure replicability of one’s research is to first replicate it on your own; for some studies this just won’t be possible, but whenever it is possible one should make sure that one’s finding holds up in a new sample. That new sample should be sufficiently powered to find the effect size of interest; in many cases, this will actually require a larger sample than the original.
It’s important to keep a couple of things in mind with regard to replication. First, the fact that a replication attempt fails does not necessarily mean that the original finding was false; remember that with the standard level of 80% power, there is still a one in five chance that the result will be nonsignificant, even if there is a true effect. For this reason, we generally want to see multiple replications of any important finding before we decide whether or not to believe it. Unfortunately, many fields including psychology have failed to follow this advice in the past, leading to “textbook” findings that turn out to be likely false. With regard to Daryl Bem’s studies of ESP, a large replication attempt involving 7 studies failed to replicate his findings (Galak et al. 2012).
Second, remember that the p-value doesn’t provide us with a measure of the likelihood of a finding to replicate. As we discussed previously, the p-value is a statement about the likelihood of one’s data under a specific null hypothesis; it doesn’t tell us anything about the probability that the finding is actually true (as we learned in the chapter on Bayesian analysis). In order to know the likelihood of replication we need to know the probability that the finding is true, which we generally don’t know.
Doing reproducible data analysis
So far we have focused on the ability to replicate other researchers’ findings in new experiments, but another important aspect of reproducibility is to be able to reproduce someone’s analyses on their own data, which we refer to a computational reproducibility. This requires that researchers share both their data and their analysis code, so that other researchers can both try to reproduce the result as well as potentially test different analysis methods on the same data. There is an increasing move in psychology towards open sharing of code and data; for example, the journal Psychological Science now provides “badges” to papers that share research materials, data, and code, as well as for pre-registration.
The ability to reproduce analyses is one reason that we strongly advocate for the use of scripted analyses (such as those using R) rather than using a “point-and-click” software package. It’s also a reason that we advocate the use of free and open-source software (like R) as opposed to commercial software packages, which would require others to buy the software in order to reproduce any analyses.
There are many ways to share both code and data. A common way to share code is via web sites that support version control for software, such as Github. Small datasets can also be shared via these same sites; larger datasets can be shared through data sharing portals such as Zenodo, or through specialized portals for specific types of data (such as OpenNeuro for neuroimaging data).
Conclusion: Doing better science
It is every scientist’s responsibility to improve their research practices in order to increase the reproducibility of their research. It is essential to remember that the goal of research is not to find a significant result; rather, it is to ask and answer questions about nature in the most truthful way possible. Most of our hypotheses will be wrong, and we should be comfortable with that, so that when we find one that’s right, we will be even more confident in its truth.
Learning objectives
- Describe the concept of P-hacking and its effects on scientific practice
- Describe the concept of positive predictive value and its relation to statistical power
- Describe the concept of pre-registration and how it can help protect against questionable research practices
Suggested Readings
- Rigor Mortis: How Sloppy Science Creates Worthless Cures, Crushes Hope, and Wastes Billions, by Richard Harris
- Improving your statistical inferences – an online course on how to do better statistical analysis, including many of the points raised in this chapter.
