
8.7 Attributions and References
Creative Commons Attributions for Text
(1) Physical Geography and Natural Disasters by R. Adam Dastrup, MA, GISP is licensed under CC BY-NC-SA 4.0
(2) Physical Geography by Lumen Learning is licensed under CC BY-NC-SA 4.0
(3) Earth Science by Lumen Learning is licensed under CC BY-NC-SA 4.0
(4) Physical Geology – 2nd Edition by Steven Earle is licensed under CC BY 4.0.
(5) Open Geography Education by R. Adam Dastrup is licensed under CC BY-NC-SA
(6) NOAA Glossary of Terms is licensed under Public Domain
(7) Introduction to Oceanography by P. Webb is licensed under CC-BY 4.0
(8) An Introduction to Geology by Chris Johnson, Matthew D. Affolter, Paul Inkenbrandt, Cam Mosher is licensed under CC BY-NC-SA 4.0
Media Attributions
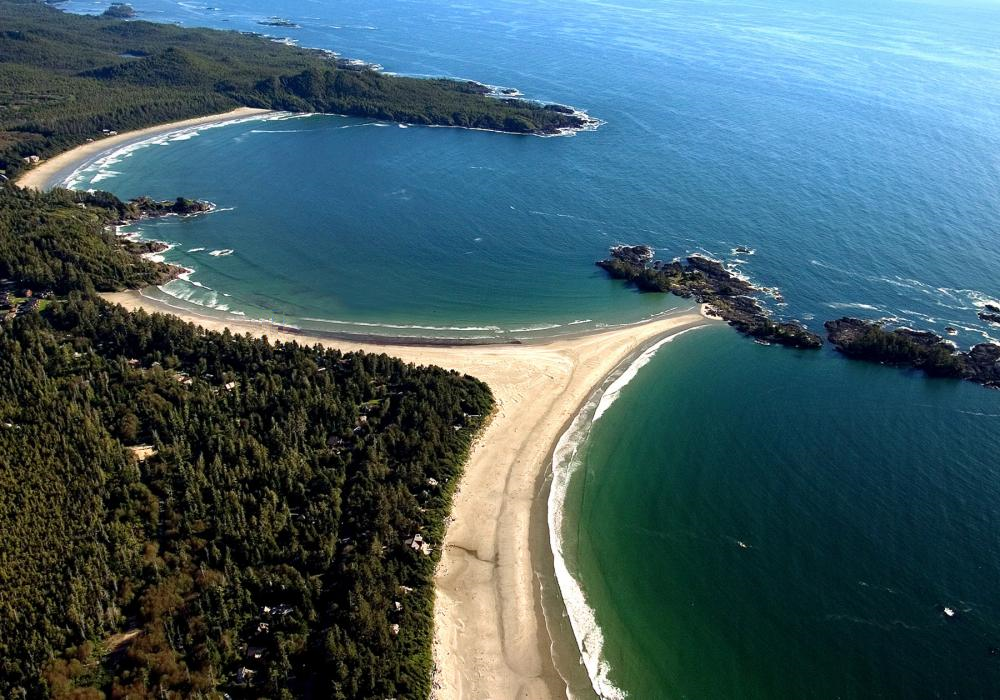
8.0.1 Earle, S (n.d.) Chesterman Beach near Tofino. Retrieved May 8, 2021 from https://opentextbc.ca/physicalgeology2ed/wp-content/uploads/sites/298/2019/06/Chesterman-Beach-near-Tofino.png
- Chesterman Beach near Tofino on the west coast Vancouver Island. The strip of sediment connecting the main beach to the rocky island is a tombolo. S. Earle, CC-BY
8.1
NASA (2019) Draining Earth’s oceans, revealing the two-thirds of Earth’s surface we don’t get to see. Retrieved May 13, 2021 from https://youtu.be/-uOwv_Krqk8
8.1.1 Wikicommons (2009). Coral Reef at the Andaman Islands. Retrieved May 6, 2021 from https://commons.wikimedia.org/wiki/File:The_Coral_Reef_at_the_Andaman_Islands.jpg
- Underwater photograph of coral reef
8.1.2 USGS (2003) Bathymetric map of the Hawaiian Islands. Retrieved May 6, 2021 from https://commons.wikimedia.org/wiki/File:Bathymetry_image_of_the_Hawaiian_archipelago.png
- Map of the seafloor showing water depth
8.1.3 Wikicommons (2015) Composition of Ocean Water. Retrieved May 6, 2021 from https://commons.wikimedia.org/wiki/File:Composition_of_ocean_water.svg
- Pie chart of the composition of ocean water.
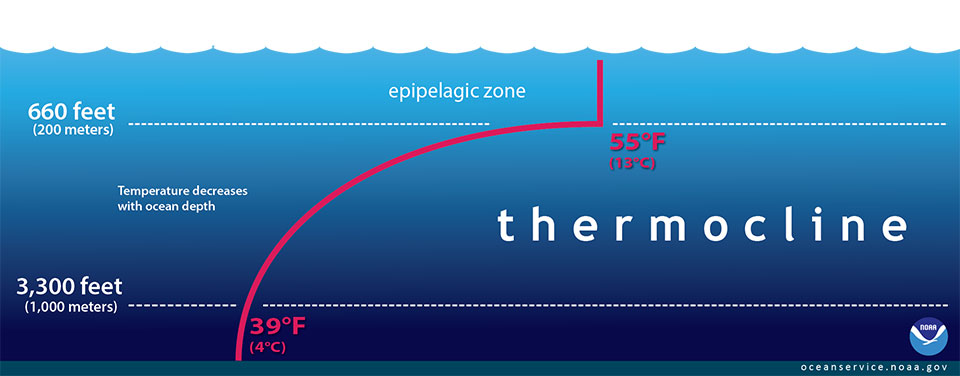
8.1.4 NOAA (n.d.) Thermocline. Retrieved May 8, 2021 from https://oceanservice.noaa.gov/facts/thermocline.jpg
- Figure showing temperature and depth of a thermocline in the ocean.
8.1.5 Fisher, M. (n.d.) Lumen Learning, Environmental Biology. Aquatic Biomes. Retrieved May 8, 2021 from https://courses.lumenlearning.com/suny-monroe-environmentalbiology/chapter/3-4-aquatic-biomes/
- Image showing divisions of the ocean relevant to water depth and distance from the shoreline.
8.2
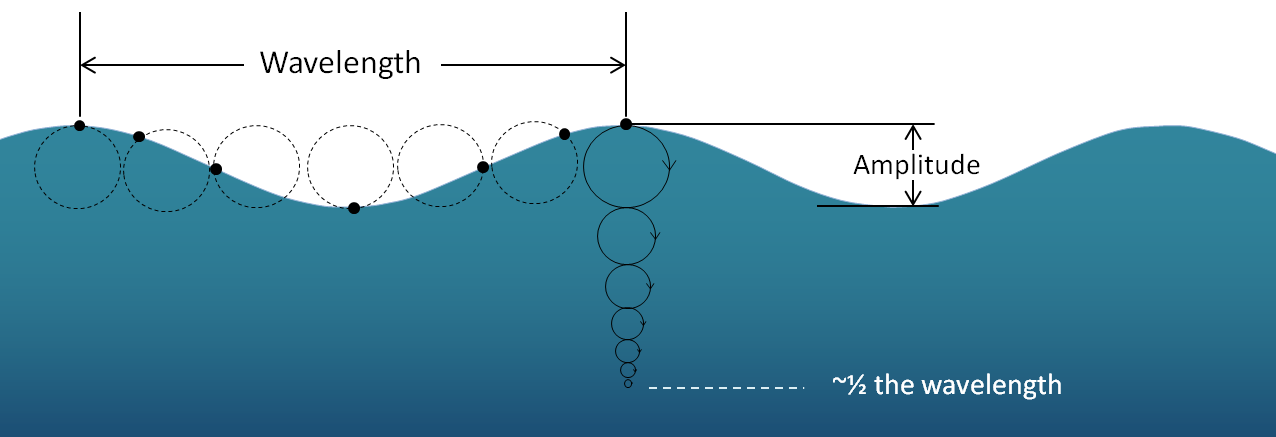
8.2.1 Earle, S (n.d.) Retrieved May 8, 2021 from https://opentextbc.ca/physicalgeology2ed/wp-content/uploads/sites/298/2019/08/orbital-motion-of-a-parcel-of-water-1.png
- The orbital motion of a parcel of water (black dot) as a wave moves across the surface.
8.2.2 Earle, S. (n.d.) Retrieved May 12, 2021 from https://opentextbc.ca/physicalgeology2ed/wp-content/uploads/sites/298/2019/08/The-effect-of-waves-approaching-a-sandy-shore-1.png
- Image showing how orbits flatten as waves approach shore.
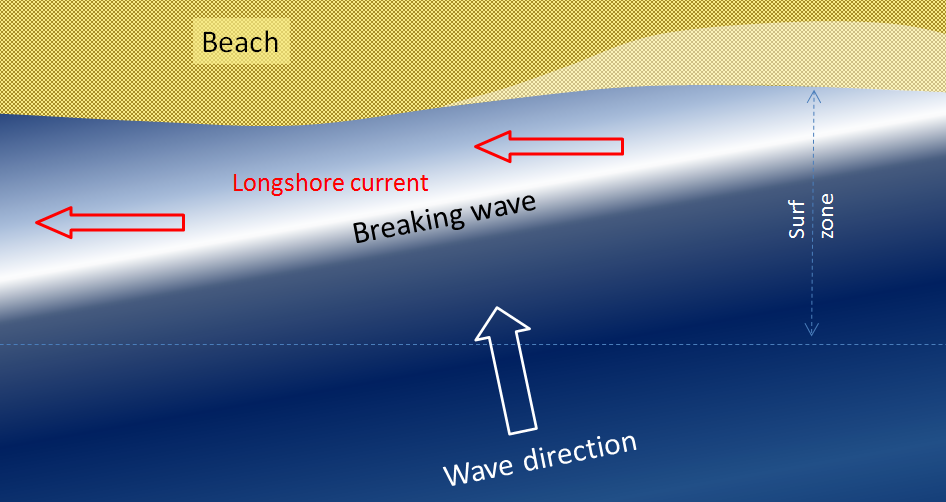
8.2.3 Earle, S. (n.d.) Retrieved May 12, 2021 from https://opentextbc.ca/physicalgeology2ed/wp-content/uploads/sites/298/2019/08/longshore-current-by-waves-approaching-the-shore-1.png
- Image showing formation of longshore current
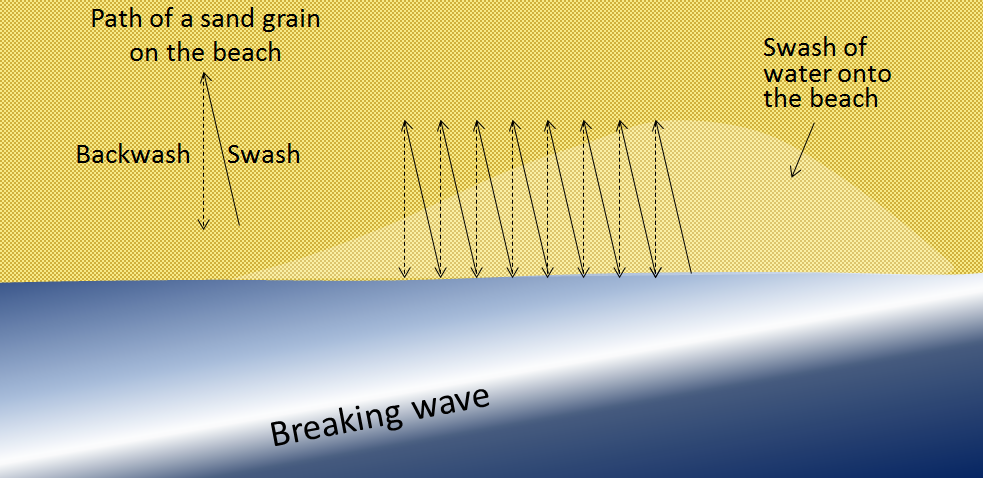
8.2.4 Earle, S (n.d.) Retrieved May 12, 2021 from https://opentextbc.ca/physicalgeology2ed/wp-content/uploads/sites/298/2019/08/swash-and-backwash-1.png
- Image showing movement of particles on a beach as a result of swash and backwash
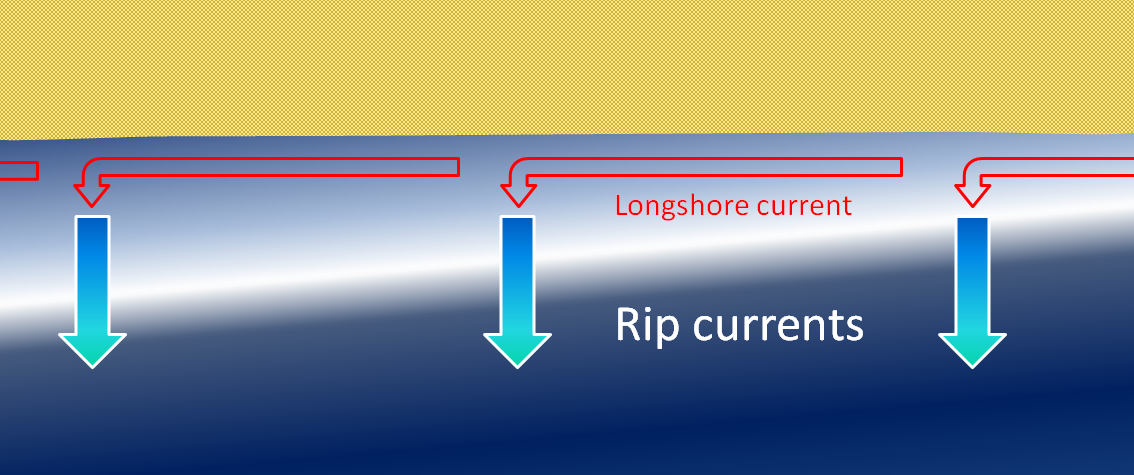
8.2.5 Earle, S. (n.d.) Retrieved May 12, 2021 from http://opentextbc.ca/geology/wp-content/uploads/sites/110/2015/08/rip-currents-on-a-beach-with-strong-surf.png
- Image showing formation of rip currents
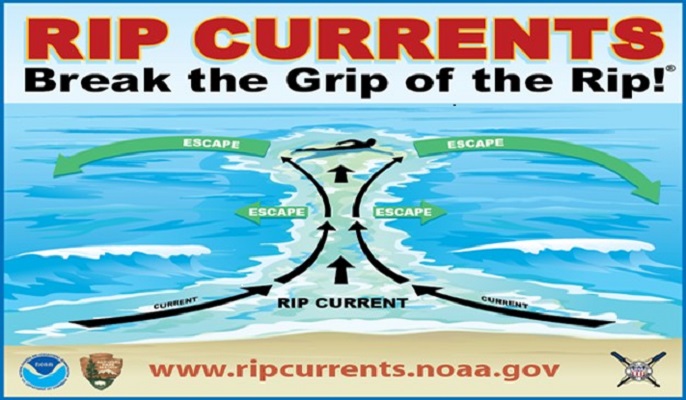
8.2.6 National Weather Service (n.d.) Rip Currents. Retrieved May 13, 2021 from https://www.nps.gov/calo/learn/news/images/RC-Break-the-Grip-of-the-Rip1.jpg
- Graphic showing how to safely escape a rip current.
NOAA (2013) Hurricane Storm Surge Retrieved May 13, 2021 from https://youtu.be/pvY0KIdmQdM
- Storm surge is water from the ocean that is pushed toward the shore by the force of the winds swirling around the hurricane. It is the greatest threat to life during a hurricane. Transcript.
NCAR (2017) Storm Surge Visualization. Retrieved May 13, 2021 from https://youtu.be/q6W_20bwqWo
- Visualization from a storm surge forecast from Hurricane Irma in 2017. The simulation demonstrates how quickly storm surge flooding can occur, coastal inundation in less than 12 seconds.
VOA Learning English (2012) The Terror of a Tsunami. Retrieved May 13, 2021 from https://youtu.be/eenxXImtgm4
- Video showing destruction from a tsunami
8.3
NASA (2012) The Ocean: A Driving Force for Weather and Climate. Retrieved May 13, 2021 from https://svs.gsfc.nasa.gov/cgi-bin/details.cgi?aid=11056
- Animation uses Earth science data from a variety of sensors on NASA Earth observing satellites to measure physical oceanography parameters such as ocean currents, ocean winds, sea surface height and sea surface temperature. Transcript
Shirah, Greg (2011) Perpetual Ocean. Retrieved May 13, 2021 from https://svs.gsfc.nasa.gov/3827
- This visualization shows ocean surface currents around the world during the period from June 2005 through December 2007. The visualization does not include a narration or annotations; the goal was to use ocean flow data to create a simple, visceral experience.
8.3.1 Wikicommons (2009) Thermohaline Circulation. Retrieved May 13, 2021 from https://commons.wikimedia.org/wiki/File:Thermohaline_circulation.png
- Map showing global thermohaline circulation
8.4
8.4.1 NASA (June 22, 2011) Topography of the Atlantic Ocean Sea Floor.
- Image showing the relative height of the Atlantic Ocean sea floor. Colors indicate different heights, with a high ridge found in the middle of the ocean, forming the Mid-Oceanic Ridge
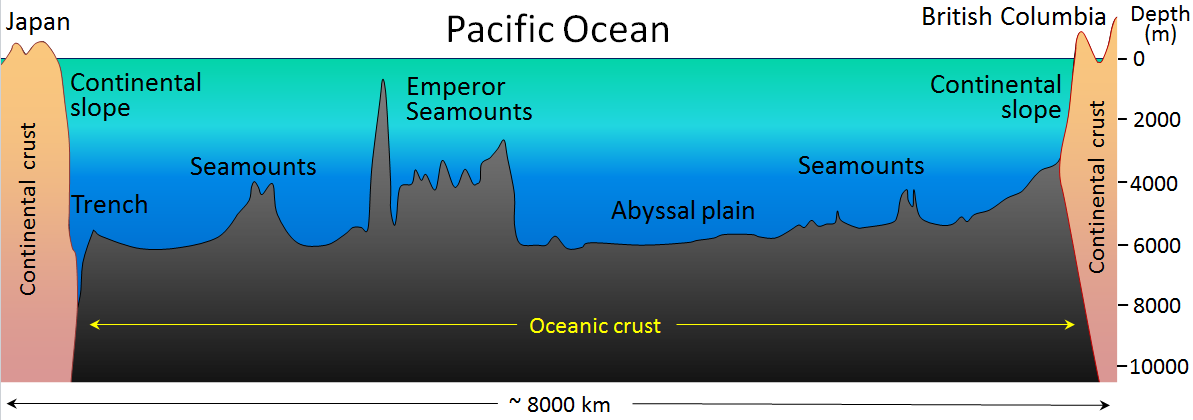
8.4.2 Earle, S. (n.d.) Generalized Topography6 of the Pacific Ocean Sea Floor. Retrieved May 25, 2021 from https://opentextbc.ca/geology/wp-content/uploads/sites/110/2015/08/generalized-topography-of-the-Pacific-Ocean-sea-floor.png
- Image showing general features of the seafloor between Japan and British Columbia. The highest points are the Emperor Seamounts in the middle, and the lowest point is the trench of the coast of Japan.
8.4.3 Earle, S. (n.d.) Coastal Straightening. Retrieved May 25, 2021 from
- An image of a coastline showing he process of headlands being cut back and the flanking beaches being widened.
8.4.4 Wikicommons (2014) Basalt sea stack. Retrieved May 25, 2021 from https://commons.wikimedia.org/wiki/Commons:Featured_picture_candidates/File:Reynisfjara,_Su%C3%B0urland,_Islandia,_2014-08-17,_DD_164.JPG#/media/File:Reynisfjara,_Su%C3%B0urland,_Islandia,_2014-08-17,_DD_164.JPG’
- Basalt sea stack in a black lava beach under the mountain Reynisfjall near the village Vík í Mýrdal, southern Iceland. The three basalt see stacks in the background are the famous Reynisdrangar.
8.4.5 Hillebrand, S. (2006) Akun Island basalt sea cave. Retrieved May 25, 2021 from https://digitalmedia.fws.gov/digital/collection/natdiglib/id/4961
- Decorative image showing a basalt outcrop with a hollowed out sea cave and arches underneath.
8.4.6 Wikicommons (2012) Beringian Margin canyons. Retrieved May 25, 2021 from https://commons.wikimedia.org/wiki/File:Beringian_Margin_canyons.png
- Screen capture from NASA WorldWind software of margin of the Bering Sea with the larger submarine canyons highlighted
8.4.7 Earle, S. (n.d.) Winter and Summer Beach Deposition. Retrieved May 25, 2021 from
- Image showing the difference between winter (rough weather) and summer (calm weather) beaches. Sand is stored offshore on the winter beach and on sure during summer.
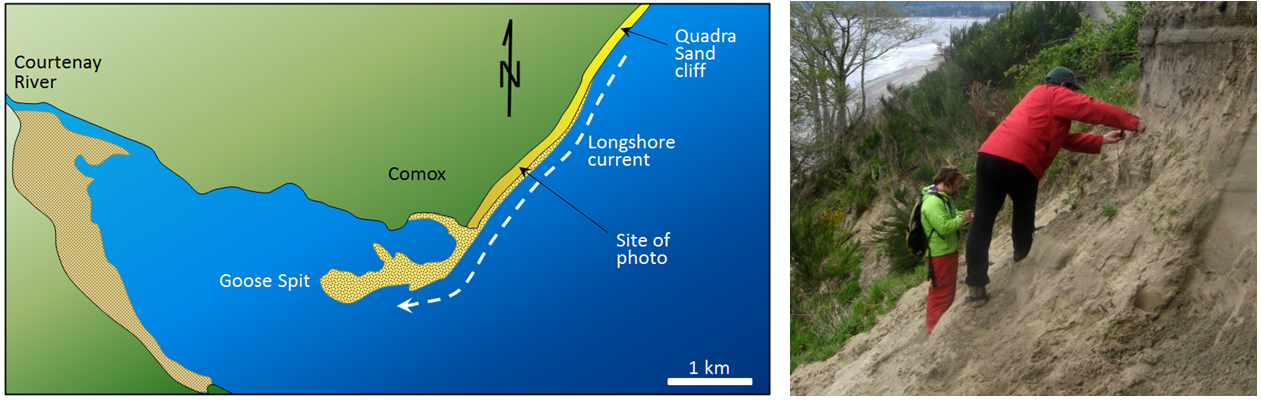
8.4.8 US Fish and Wildlife Service (n.d.) Goose Spit at Comox on Vancouver Island. Retrieved May 25, 2021 from https://opentextbc.ca/physicalgeologyearle/wp-content/uploads/sites/145/2016/03/comox-2.png
- Image of a spit forming due to longshore currents.
8.4.9 Chiou, L. (2016) Barrier Islands of South Shore Long Island. Retrieved May 25, 2021 from https://upload.wikimedia.org/wikipedia/commons/thumb/e/e0/LI_Barrier_Islands-1.jpg/366px-LI_Barrier_Islands-1.jpg
- Aerial image of a barrier island.
8.5
8.5.1 NASA (2019) Satellite Sea-level observations. Retrieved May 13, 2021 from https://upload.wikimedia.org/wikipedia/commons/9/98/NASA-Satellite-sea-level-rise-observations.jpg
- Graphic showing rate of change of sea level over the past 25 years.
NASA (2020) Rising Tides: Understanding sea level rise. Retrieved May 25, 2021 from https://climate.nasa.gov/climate_resources/199/rising-tides-understanding-sea-level-rise/
- Video showing the causes for sea level rise.
Willis, J. (2015, Sep 2) Watching Rising Seas from Space. Retrieved June 1, 2021 from https://youtu.be/z2UKvrU5rOk
- Video showing Oceanographer Josh Willis from NASA’s Jet Propulsion Laboratory narrates this video about the causes of sea level rise and how sea level has changed over the last two decades as observed by the Jason series of satellite missions.
NASA (2020) Impacts of Sea Level Rise on Coastal Virginia. Retrieved May 13, 2021 from https://youtu.be/8Pn4rQZ0rHQ
- Video showing how sea level rise affects coastal Virginia
8.5.2 Wilson, M (2021) Grand Canyon Sequence.
- Image showing the uppermost rock types of the Grand Canyon and how they have changed composition due to sea-level changes over time.
8.6
8.6.1 Wikimedia Commons (2007) Isle of Wight Centre for the Coastal Environment. Retrieved June 1, 2021 from https://commons.wikimedia.org/wiki/File:Seawallventnor.jpg
- Image showing a seawall
8.6.2 National Park Service (n.d.) Groins and Jetties. Retrieved June 1, 2021 from https://www.nps.gov/articles/groins-and-jetties.htm
- Image showing groins and jetties on a coastline
8.6.3 Wilson, M. modified from GoogleEarth (2021) Breakwater off Long Beach, CA.
- GoogleEarth image with the breakwaters labeled with arrows.
8.6.4 Wikimedia Commons (2017) Retrieved June 1, 2021 from https://pixabay.com/photos/dredging-nourishment-beach-sand-2955269/
- Image showing sand being brought to the beach for replenishment
NOAA (2015) Your Earth is Blue: Coral Reef Bleaching. Retrieved May 13, 2021 from https://youtu.be/09zqo1KtRxU
- Video of coral bleaching due to ocean temperature change.
NOAA (2018) Microplastics. Retrieved May 13, 2021 from https://youtu.be/sK4XeKAxuUU
- Video showing the issue of plastics in oceans
Ocean MOOC (2017) From Ocean Science to Ocean Sustainable Development. Retrieved May 13, 2021 from https://youtu.be/Bo3bJfJtKUU
- Video showing how sustainable development can occur through the 5 P’s: peace, people prosperity partnership and planet
Instructor Resources
8 OCEANS AND COASTAL ENVIRONMENTS Text (June 1, 2021)
