
33 Spectral Lines
J. A. Hester
Emission and Absorption Lines
There are two types of light that we can observe from any object. The first is reflected light. Most of the light we see is created by the Sun, a light bulb, a screen, or another light source and then reflects off of the objects around us before entering our eyes.
The other type of light is light that is radiated by an object itself. One example is thermal radiation, which was introduced in a previous lesson. In our solar system, the Sun is the most obvious example of an object radiating its own light, but it isn’t the only one. Any dense object emits thermal radiation, light that is created by the thermal motions of an object’s atoms and molecules.
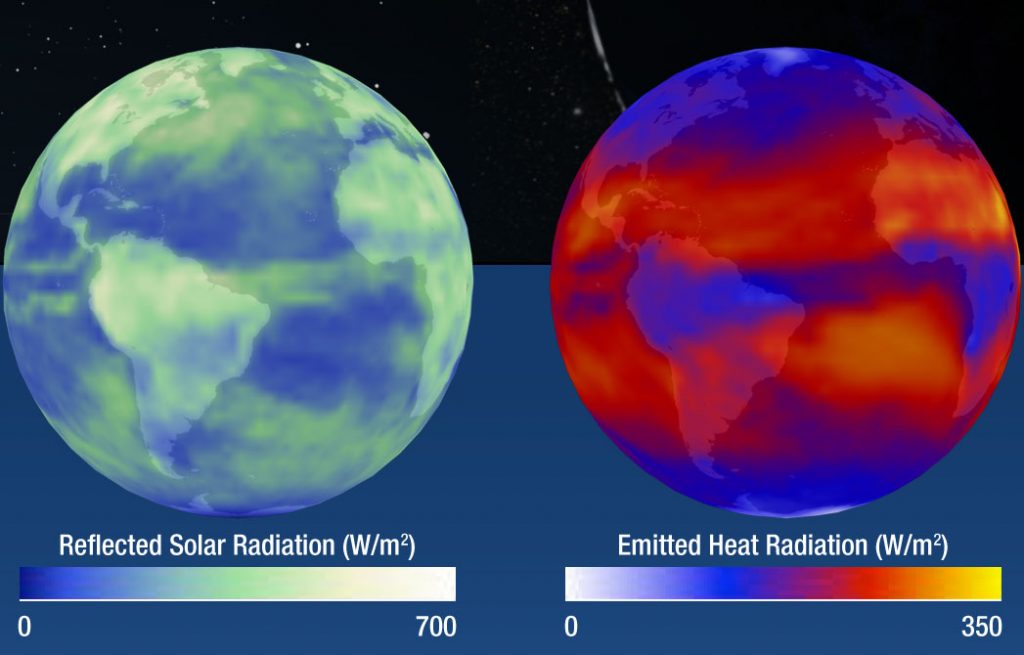
People and animals, with body temperatures around 310 K, radiate at wavelengths around 9 microns. You can see this light with an infrared (IR) camera. The Earth, with an average surface temperature of 288 K also emits thermal radiation in the IR. The image below shows sunlight reflected from the Earth’s atmosphere and surface (visible light) and thermal emission from the Earth’s atmosphere and surface (IR light).
The light reflected by, absorbed by, and emitted the objects in our solar system (and other planetary systems) is the primary way that we learn about these objects. Missions have sampled the atmospheres and surfaces of other worlds, and meteorites are also analyzed to learn about their parent bodies. The large majority of what we know, however, we’ve learned by analyzing light.
In the lesson on thermal emission, we learned that one thing we can determine from an object’s spectrum (when the light from an object is spread out by wavelength) is its temperature. This lesson focus on how we can also use spectra to learn about an object’s composition.
To start, we’ll look at the spectrum of a star. Most of the light from a star is thermal emission; the dense plasma that the star is made from radiates like a blackbody. If you look at a the spectrum of a star, however, you see dips and spikes.
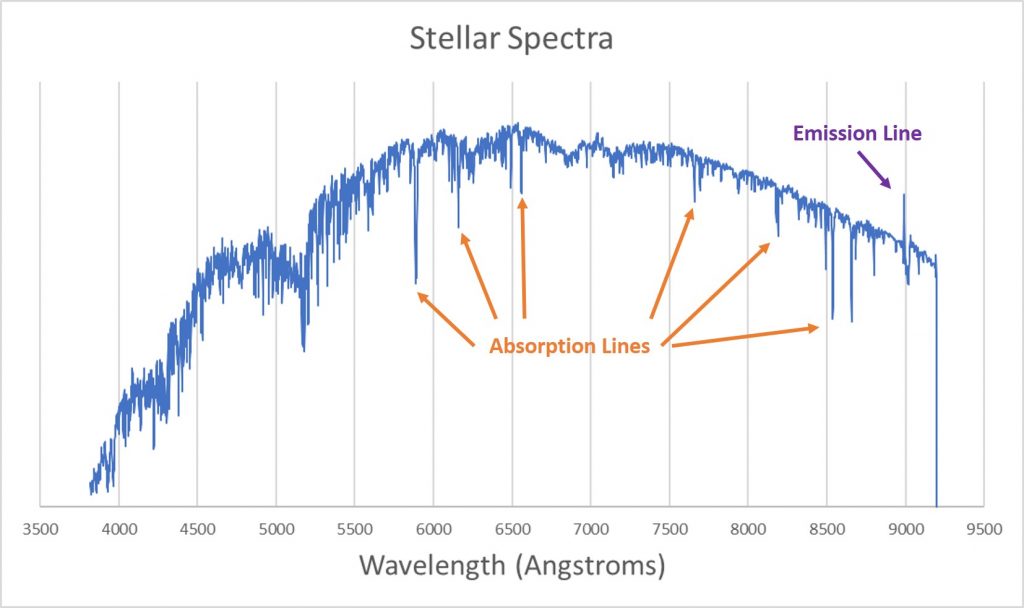
The dips are called absorption lines; they’re wavelengths at which light is missing from the underlying blackbody spectrum. The spike (there is only one in this spectrum) is called an emission line; at this wavelength there is extra light that isn’t part of the blackbody spectrum.
When a fine grating is used to spread out the Sun’s spectrum, many absorption features are visible (dark bands in the image below).
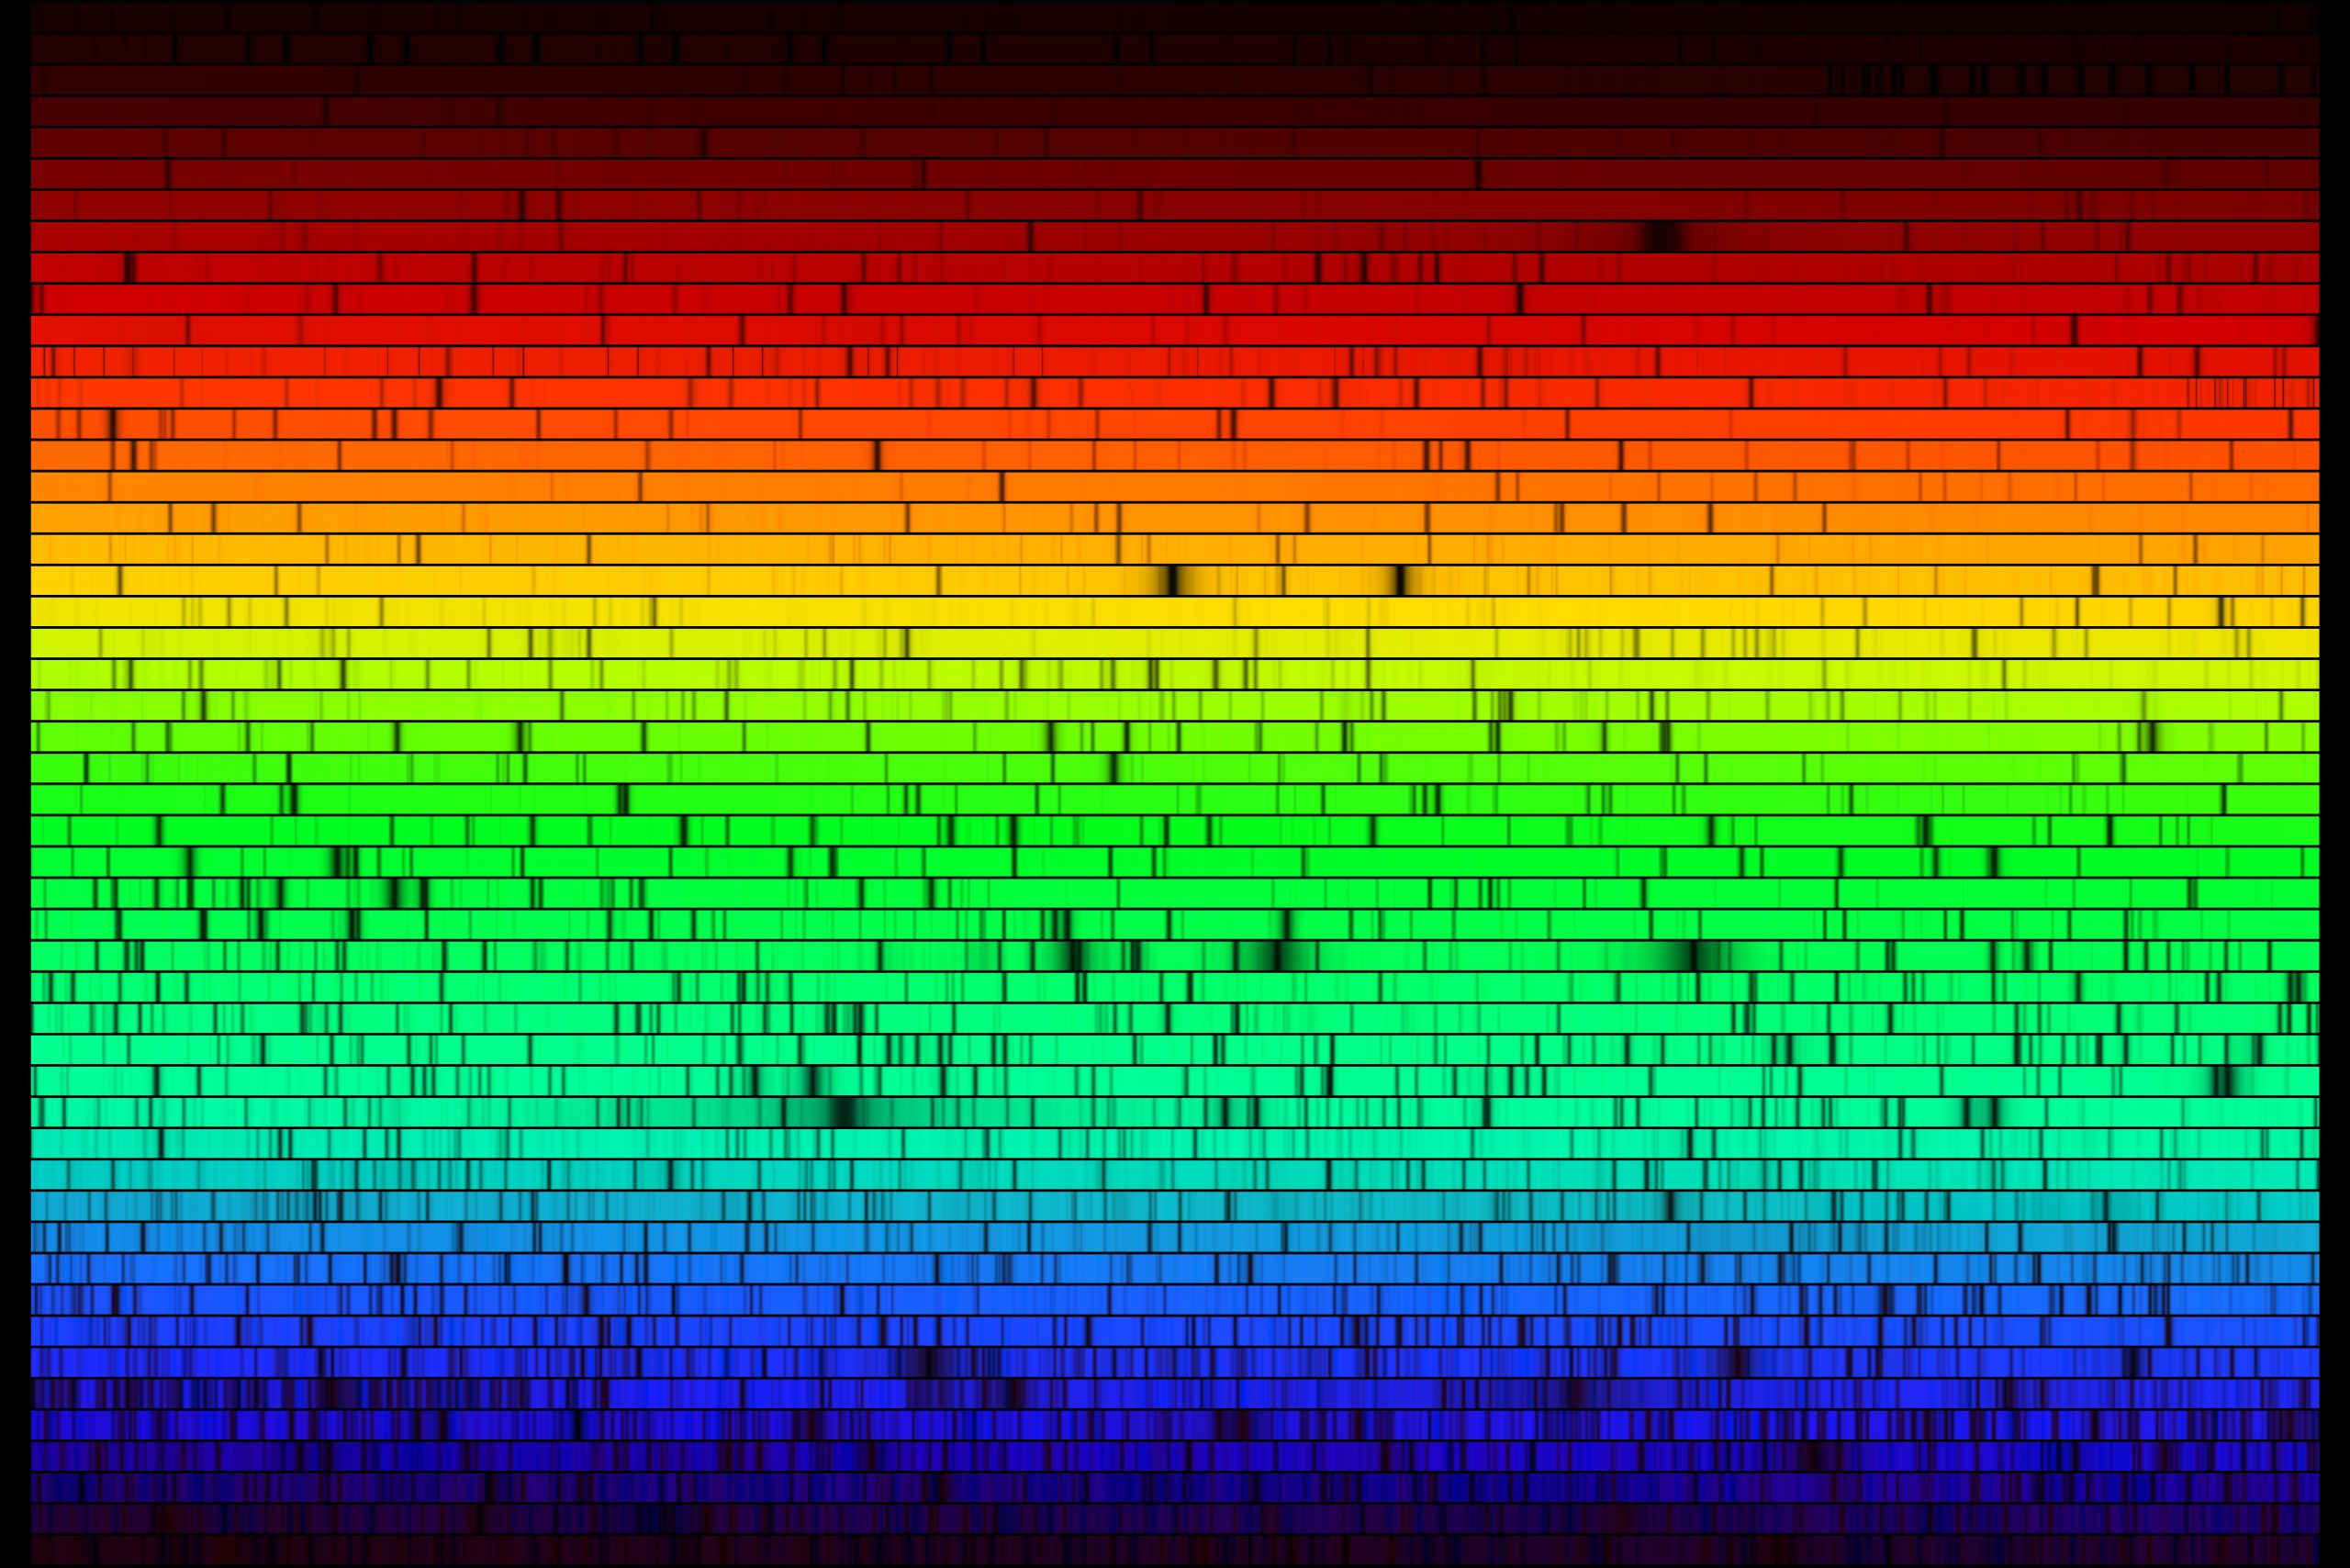
These lines aren’t unique to stellar spectra. They are also seen; for example, in spectra of planetary atmospheres.
Photons
The key to understanding emission and absorption lines is photons. Photons are quanta, or packets, of light energy. Whenever light is created or destroyed, it is created and destroyed as photons.
Photons and the Electromagnetic Spectrum
The photons of different colors (wavelengths or frequencies) of light differ from each other. The higher the frequency of the light (the shorter the wavelength), the higher the energy of the photon. Use this to answer the next two questions.
Photons are the reason that visible light is harmless, UV light can give you a sunburn, too many X-rays can cause cancer, and too many gamma-rays can be fatal. When a photon is destroyed, it deposits all of its energy in one place. The energy carried by an X-ray photon or a gamma-ray photon can damage your tissue; a single photon of visible light can’t.
Atomic Spectra
The image below shows the spectrum from several atomic light bulbs. These bulbs are similar to neon bulbs; they contain a thin (diffuse) gas of a single element. When electrons are passed through the gas they energize it and cause it to glow.
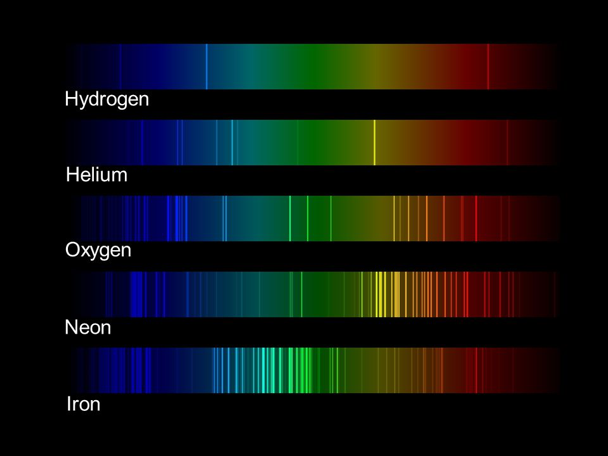
This image was downloaded from a NASA activity that shows you how to build a spectroscope using a cereal box and an old CD. You can clearly see the bright, single-color lines that make up these spectra.
When answering the following questions, use what you learned about photons above.
Periodic Table of Spectra
Answer the following question based on knowledge from a previous science class. If you do not know the answer to this question, please look it up.
You can see the emission line spectra for all of the elements at this webpage (Interactive Atomic Spectra). If you click one of the elements, its spectra appears. Use this tool to answer the following questions.
Energy Levels and Spectral Lines
Watch this video before attempting the questions that follow.
Hydrogen Emission Lines
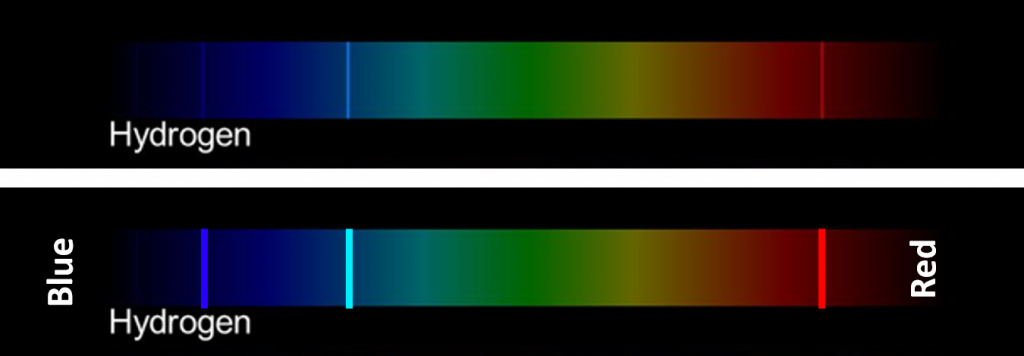
The figure below shows an emission line spectrum for hydrogen. The top line is a picture of the spectrum, as viewed through a spectroscope. The bottom line marks the position of the three visible emission lines.
Hydrogen Energy Levels
The next figure is a diagram representing the energy levels of the hydrogen atom.
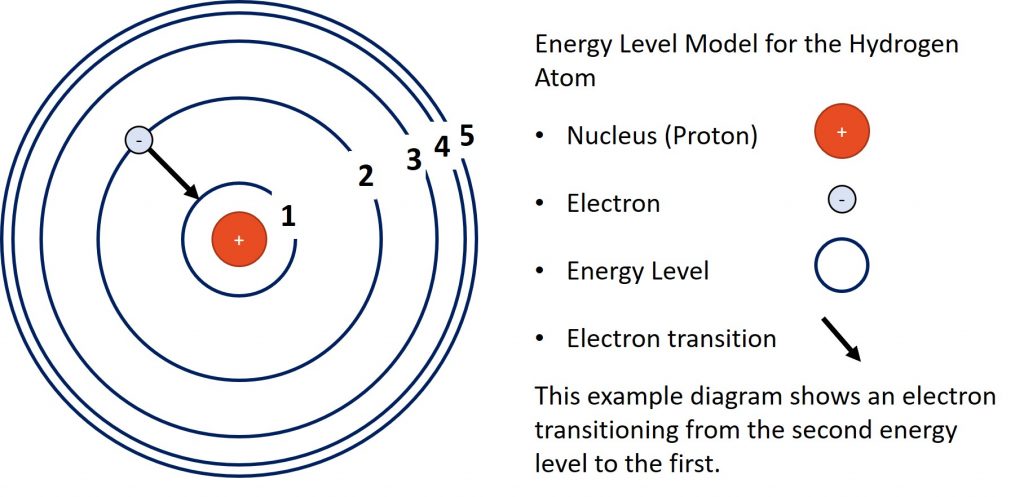
In the transition in the diagram, the electron is loosing energy as it drops from the second energy level to the first. In the model, the further away an energy level is from the nucleus, the higher its energy. Electrons must gain energy to move out energy levels and they loose energy when they move in energy levels.