
13 The Human Population
Learning Objectives
After studying this chapter, you should be able to:
- Discuss how the human population is growing exponentially
- Explain how fertility rate affects the growth of a population
- Explain how humans have expanded the carrying capacity of their habitat
- Relate population growth and age structure to the level of economic development in different countries
- Compare the ecological footprints of countries with different levels of development
- Discuss the long-term implications of human population growth and resource consumption
Human Population Growth
Concepts of animal population dynamics can be applied to human population growth as well. Humans are not unique in their ability to alter their environment. For example, beaver dams alter the stream environment where they are built. Humans, however, have the ability to alter their environment to increase the carrying capacity, sometimes to the detriment of other species. Earth’s human population and their use of resources are growing rapidly, to the extent that some worry about the ability of Earth’s environment to sustain its human population. Long-term exponential growth carries with it the potential risks of famine, disease, and large-scale death, as well as social consequences of crowding such as increased crime. However, the exponential growth rate appears to have reached its peak in the 1960s. The human population is still growing, but at a slower rate, with some countries even experiencing a population decline. This has introduced a new set of economic and social problems.
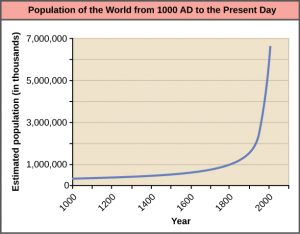
The world’s human population is presently growing exponentially. A consequence of exponential growth rate is that the time that it takes to add a particular number of humans to the population grows shorter over time. The population was about 500 million people in the year 1650 and it took 200 years for that number to double to one billion. But it only took 80 years for the population to double again to two billion, and 45 years to double yet again to 4 billion. As of 2018, there were about 7.6 billion people on the planet, and that number is expected to reach 8 billion by 2024 (Figure 1). But will that number double again?
Predicting how quickly the population will grow in the future is difficult, since there are so many factors that affect birth and death rates around the world. Currently, the global growth rate, or the percent change in population per year, was 1.05% in the year 2020. Although this may not seem like much, this growth rate results in the addition of about 82 million people per year. However, the current growth rate is much lower than the peak growth rate of 2.1% per year in 1962. We can use the so-called “rule of 70” calculate a rough estimate of when an exponentially growing population can be expected to double:
[latex]Population\:doubling\:time\:in\:years = 70\div growth\:rate\:%[/latex]
Inputting the 2020 growth rate of 1.05% reveals that it would take about 67 years for the population to double again:
[latex]70\div 1.05 = 66.67\:years[/latex]
This means that while the human population continues to grow exponentially, the rate of growth is slowing, and in fact is likely to level off within a few decades. Most demographers (scientists who study population trends) doubt the population will double again to 16 billion due to this slowdown.
Fertility Rate and Population Growth
The growth rate of a country (or the world as a whole) is largely driven by the total fertility rate (TFR), or the average number of children born to women during their reproductive years. For a population to remain stable, a total fertility rate of about 2.1 is required. This number is known as the replacement fertility rate, as it would allow for the replacement of two parents, with a slight allowance for children who die before reproducing. In general, a population with a fertility rate higher than 2.1 is expected to grow, while a fertility rate of less than 2.1 leads to a shrinking population. Note that the replacement fertility rate would need to be somewhat higher than 2.1 in countries with an especially high child mortality rate.
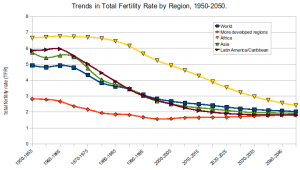
Fertility rates have dropped dramatically since the “baby boom” of the 1950s and 1960s (Figure 2). The global TFR in 1950 was nearly 6 children per woman, but it has fallen to just below 2.5 as of 2019. If this trend continues, the world will achieve the replacement fertility rate by 2050, meaning the population will begin to stabilize. Demographers attribute this reduction in fertility to many factors, most of which are related to increasing standards of living as the wealth of countries increases over time. These factors are discussed in more detail below.
Knowledge Check
Overcoming the Carrying Capacity
Humans are unique in their ability to alter their environment in myriad ways. This ability is responsible for human population growth because it resets the carrying capacity to allow for more humans to be supported. Much of this ability is related to human intelligence, society, and communication. Humans construct shelters to protect themselves from the elements and have developed agriculture and domesticated animals to increase their food supplies. In addition, humans use language to communicate this technology to new generations, allowing them to improve upon previous accomplishments.
Other factors in human population growth are migration and public health. Humans originated in Africa, but we have since migrated to nearly all inhabitable land on Earth, thus, increasing the area that we have colonized. Public health, sanitation, and the use of antibiotics and vaccines have decreased the ability of infectious disease to limit human population growth in developed countries. In the past, diseases such as the bubonic plague of the fourteenth century killed between 30 and 60 percent of Europe’s population and reduced the overall world population by as many as one hundred million people. Infectious disease continues to have an impact on human population growth. For example, life expectancy in sub-Saharan Africa, which was increasing from 1950 to 1990, began to decline after 1985 largely as a result of HIV/AIDS mortality. The reduction in life expectancy caused by HIV/AIDS was estimated to be 7 years for 2005. Declining life expectancy is an indicator of higher mortality rates and leads to lower birth rates.
The fundamental cause of the acceleration of growth rate for humans in the past 200 years has been the reduced death rate due to a development of the technological advances of the industrial age, urbanization that supported those technologies, and especially the exploitation of the energy in fossil fuels. Fossil fuels are responsible for dramatically increasing the resources available for human population growth through agriculture (mechanization, pesticides, and fertilizers) and harvesting wild populations.
Age Structure and the Demographic Transition
The age structure of a population is an important factor in population dynamics. Age structure is the proportion of a population in different age classes, or cohorts. Age structure is illustrated using a special graph called an age structure diagram, also known as a population pyramid. As you can see in the figures below, each bar in an age structure diagram usually represents the number of people within a five-year age class (5-9 years, 10-14 years, etc.). The diagram also divides the population into males and females to account for any gender differences in population numbers. Models that incorporate age structure allow better prediction of population growth, plus the ability to associate this growth with the level of economic development in a region. Countries with rapid growth have a truly pyramidal shape in their age structure diagrams, showing a preponderance of younger individuals, many of whom are of reproductive age. Figure 3 shows the age structure of the Central African Republic, a country with a rapidly growing population.
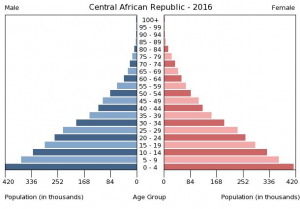
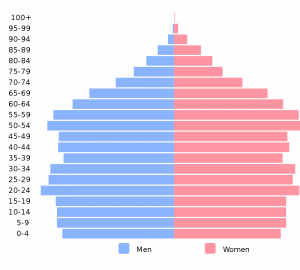
Figure 4 shows the age structure of the United States, which has a slowly growing population.
Demographers attribute the differences in growth rates among countries with different levels of development to a phenomenon known as the demographic transition. The demographic transition is a theory that countries tend to shift from high birth and death rates to lower birth and death rates as they become wealthier and more industrialized. Most developed countries, such as the United States, Canada, and Australia, have completed the demographic transition and now have low birth rates. Developing countries are at an earlier stage in the transition. This model predicts that death rates will decrease fairly early in a country’s development, followed by a drop in birth rates as the country’s wealth increases. Eventually, the birth rate and death rate achieve equilibrium, leading to a stable population. in some cases, the birth rate even drops below the death rate, which can cause the population to shrink (Figure 5).
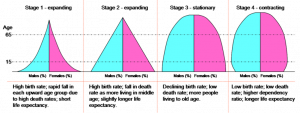
The demographic transition is believed to progress through four stages, as seen in Figure 5. Stage 1 occurs in pre-industrial societies, where death and birth rates are both high. Family planning and contraception are rare, so women tend to have many children. However, lack of food and medical care reduce survival, especially among infants and children. Therefore, societies in this stage have a stable or slowly growing population. All countries were in Stage 1 until the Industrial Revolution and medical advances of the 18th and 19th centuries allowed for more children to survive infancy. Very few societies remain in this stage, but it may be found in traditional hunter-gatherer societies, such as those who live in isolated parts of the Amazon rainforest.
Stage 2 of the demographic transition leads to a decrease in the death rate while birth rates remain high, leading to a rapid increase in population. The decline in the death rate is mainly due to improvements in technology, agriculture, and public health. Most European countries achieved this stage during the Industrial Revolution. Iraq, Afghanistan, and much of sub-Saharan Africa (countries south of the Sahara Desert) are currently in Stage 2 of the transition.
As countries enter Stage 3 of the demographic transition, death rates remain low and birth rates begin to decrease. The decline in the birth rate eventually leads to a slowly growing or stable population. Reasons for the dropping birth rate vary from country to country, but are generally some combination of economic and social factors. Access to birth control increases as societies grow wealthier, allowing families to have more control over their fertility. More women become educated and enter the workforce, affording them opportunities outside the traditional role of mother and caretaker. As rural families move into urban areas, the cost of raising children often increases, and parents realize fewer children are needed to work on farms or help run the family business. El Salvador, Costa Rica, Indonesia, and India are all countries that are currently in Stage 3 and are experiencing a decrease in fertility.
Countries that have fully industrialized now enter Stage 4 of the demographic transition. In this stage, birth rates fall to right around the death rate, leading to a stable population. Lower rates of disease and abundant food mean most people are able to live long healthy lives. Readily available contraception and greater independence and economic opportunity for women allows families more freedom to decide when and if they want children. Mexico, Canada, the United States, and most of Europe are currently in stage 4 of the demographic transition and have achieved or are approaching a stable population.
As birth rates continue to fall and death rates remain low, some countries experience a declining population. This decline is now occurring in Japan, Italy, and several Eastern European countries, and it has led to concerns about slowed economic growth as the working age population shrinks and the elderly population balloons. In fact, Japan is now providing economic incentives to encourage couples to have more children, and some countries are loosening restrictions on immigration to replace the declining native-born workforce.
Knowledge Check
Population and Ecological Footprints
Recall from an earlier chapter that population size is only one factor that determines the impact of humans on the environment. The IPAT equation states that environmental impact depends on the size of population, the affluence (or level of resource consumption) of the people in the population, and the technology level of the society.
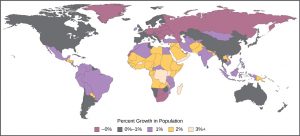
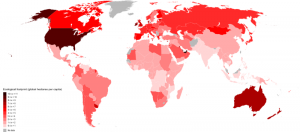
While many countries in the developing world are currently experiencing rapid population growth, the environmental impact of these countries remains low because the citizens of these countries consume far fewer resources than those in developed countries. The countries with the highest growth rate (Figure 6) tend to have the smallest ecological footprints (Figure 7).
Long-Term Consequences of Human Population Growth and Consumption
Many dire predictions have been made about the world’s population leading to a major crisis called the “population explosion.” In the 1968 book The Population Bomb, biologist Paul R. Ehrlich and his wife Anne wrote, “The battle to feed all of humanity is over. In the 1970s hundreds of millions of people will starve to death in spite of any crash programs embarked upon now. At this late date nothing can prevent a substantial increase in the world death rate.” While many critics view this statement as an exaggeration, the laws of exponential population growth are still in effect, and unchecked human population growth cannot continue indefinitely.
Efforts to moderate population control led to the one-child policy in China, which imposed fines on urban couples who have more than one child. Due to the fact that some couples wish to have a male heir, many Chinese couples continue to have more than one child. The effectiveness of the policy in limiting overall population growth was controversial, as was the policy itself. Moreover, there are stories of female infanticide having occurred in some of the more rural areas of the country. In 2015, the Chinese government relaxed the policy and now allows all families to have two children.
Family planning education programs in other countries have had highly positive effects on limiting population growth rates and increasing standards of living. In spite of population control policies, the human population continues to grow. Because of the subsequent need to produce more and more food to feed our population, inequalities in access to food and other resources will continue to widen. The United Nations estimates the future world population size could vary from 6 billion (a decrease) to 16 billion people by the year 2100. There is no way to know whether human population growth will moderate to the point where the crisis described by the Ehrlichs will be averted.
Another consequence of population growth and increased consumption is the change and degradation of the natural environment. Many countries have attempted to reduce the human impact on climate change by limiting their emission of greenhouse gases. However, a global climate change treaty remains elusive, and many underdeveloped countries trying to improve their economic condition may be less likely to agree with such provisions without compensation if it means slowing their economic development. Furthermore, the role of human activity in causing climate change has become a hotly debated socio-political issue in some developed countries, including the United States. Thus, we enter the future with considerable uncertainty about our ability to curb human population growth and consumption, thereby protecting our environment for the long term.
Knowledge Check
Attribution
“The Human Population” in OpenStax Concepts of Biology, modified by Sean Whitcomb. License: CC BY
Media Attributions
- Population_exponential © OpenStax is licensed under a CC BY (Attribution) license
- Trends_in_Total fertility rate_1950-2050 © Rcragun is licensed under a CC BY (Attribution) license
- Population_pyramid_of_the_Central_African_Republic_2016 © CIA is licensed under a Public Domain license
- PopulationPyramid_USA.svg © Ferran Velasco is licensed under a CC BY (Attribution) license
- Demographic_transition_pyramids © SuzanneKn is licensed under a Public Domain license
- Population_growth_map © OpenStax is licensed under a CC BY (Attribution) license
- World_map_of_countries_by_ecological_footprint © Institut-Escola Les Vinyes is licensed under a CC BY-NC-SA (Attribution NonCommercial ShareAlike) license
