
4.2 Map Design and Map Elements
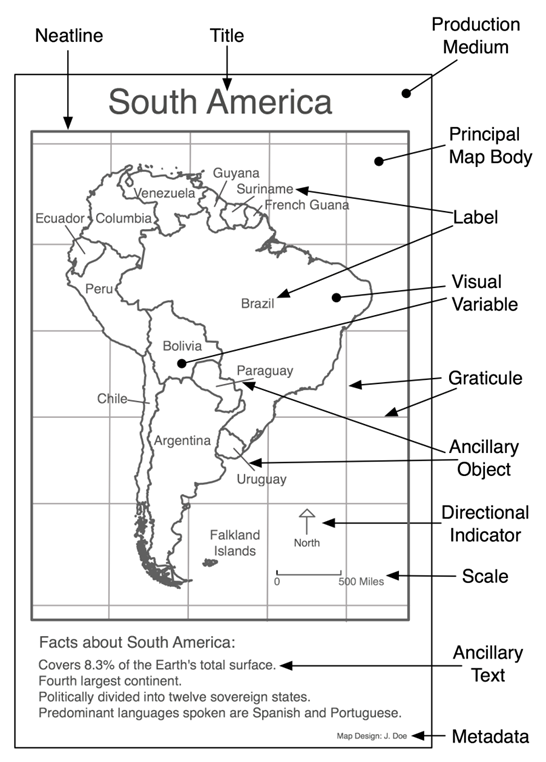
A map is composed of multiple parts known as map elements. Map elements that may be included on the map are a neat line, map body, graticule, insets, title, legend, label, ancillary text, ancillary object, scale bar, directional indicator, and metadata. It is important to note that not all map elements are required for every map. In fact the only map element required to create a map is the map body which is what shows the data.
In the image the map elements are listed from top to bottom. The elements towards the top of the list are larger in size and the elements at the bottom of the list are smaller in size. On a map elements are sized relative to their importance to the map reader. For the rest of the section, we will discuss each map element in detail including its purpose, and design considerations.
Title
The first map element to discuss is the title. The purpose of the title is to focus attention on the purpose the map; therefore, it is dominant in size and is typically placed at the top of the map and centered. A good map title is brief and will typically include where, what, and when as related to the map’s topic. Every map should have a map title, however a common reason not to put a title on the map is if the map is a figure in a larger body of text and in it the map will have a caption. In that case place a map title as the caption text. You should avoid ornate or complex fonts for the map title so that it is easy for the map user to read quickly and with these. You should also use a bounding box around the title if the legibility of the title is decreased due to elements of the map. The following are examples of map titles.
Title Example
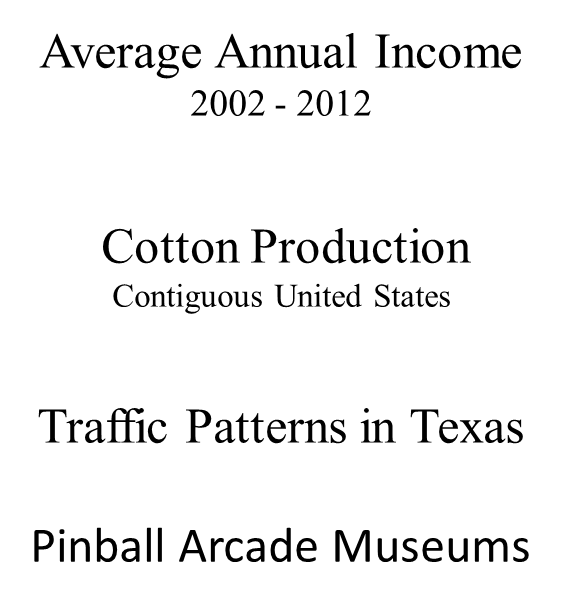
Figure 4.6 is an example of a map with the title “average annual income 2002-2012”. This is a good map title as it uses a simple font that discusses the why and the when of the subject matter. The second example is “corn production contiguous United States”. This too, is a good map title as it states in a clear font the: what and the where. Perhaps a statement about what time period the map covers would be useful.
The third title example is “traffic patterns in Texas”. This map title leaves a little to be desired as it does not tell us important information about the time coverage of a map. As traffic patterns often change throughout time and based off of seasons, holidays, or workdays, the map title has a little too much ambiguity. The last title example is “pinball arcade museums”. This is a reasonable map title, but perhaps the specification of where the map covers and what time period the map covers would be useful.
Map Body
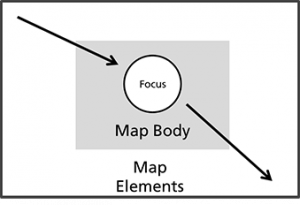
The map body map element is the main focus of the map and should be visually dominant in every case. The map body contains the features important to the message of the map. The map body should be made as large as possible on the medium but should also leave room for other map elements and should not crowd the edges so that the map has a little “breathing room”. The map body is the only map element that is absolutely required when composing a map. However, the map is often much more useful when other map elements are included. Review Figure 4.7.
Map Body Varieties
There are two map body varieties: cropped and floating. Both map body varieties are widely used so it really comes down to preference when designing your map.
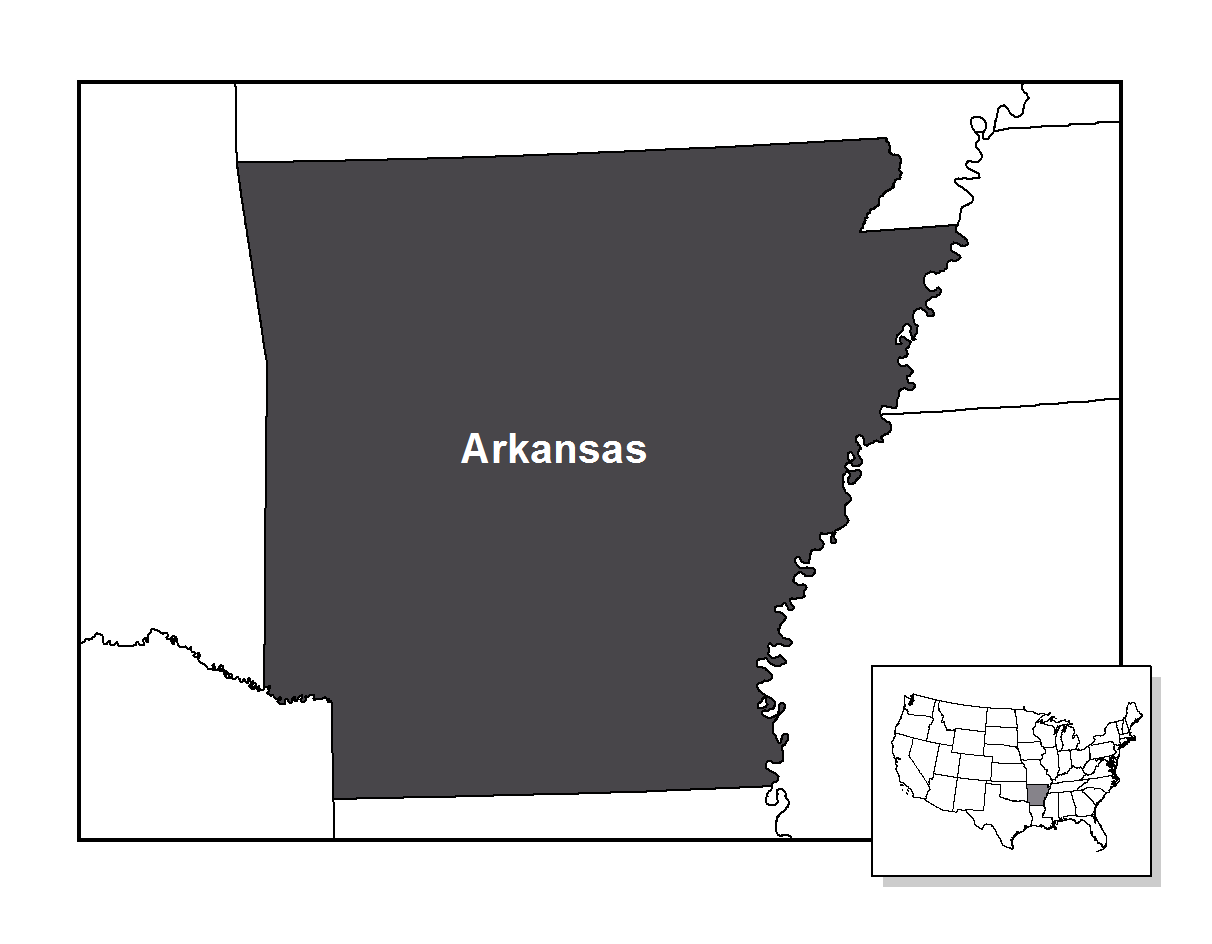
Cropped
A cropped map body represents a region of interest within a geographic context and the surrounding area is cut off often by a neat line. Figure 4.8 illustrates a cropped map showing Arkansas and portions of surrounding states for context.
Floating Map
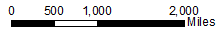
A floating map body is a region that is disconnected from neighboring regions. This might confuse map readers. However, it is good for opening space up for placement of other map elements. Figure 4.9 is a floating map that shows the contiguous United States, but does not show oceans, the Gulf of Mexico, or Canada and Mexico which might provide important context.
Inset Map
An inset map element is a small ancillary map that is typically larger in scale than the map body. The purpose of the inset map is to show more detail in the map body. For instance, it is common to see inset maps of the New England area when looking at a map of the states because there is so much detail that cannot be shown at a map scale that shows the entire United States.
To learn where the inset map is covering, an outline of the extents of the inset map may be shown on the main map body. Another use for an inset map to show other areas related to the primary map body, but at a different scale or location. A common example of this is when showing all 50 states (Figure 4.10), where Alaska and Hawaii are placed as inset maps. In this case, typically, Alaska is shown at a reduced scale and Hawaii is shown at an enlarged scale.
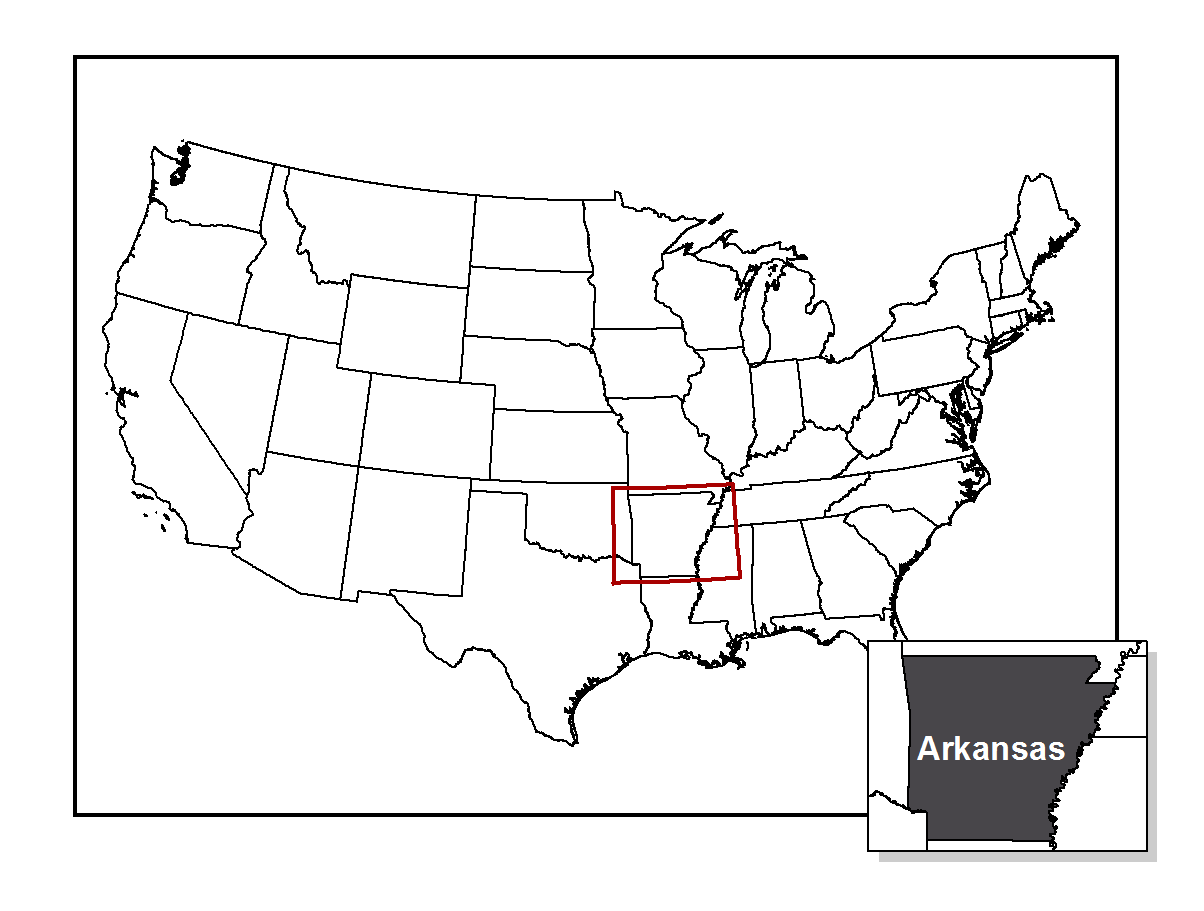
Location Map
A location map is a small ancillary map that is at a smaller scale than the map body. The purpose of the location map is to identify the location of the main map body in relation to its larger geographic context. You should include location map on your map layout with the area is unfamiliar or non-intuitive to a map reader. For example, review Figure 4.11.
Map Scale
The next map element is map scale. The purpose of the map scale is to measure linear relationships and distances on the map. Map scale should use a unit of measure that is appropriate for the audience and its purpose. Additionally, the map scale should be subtle and small. The scale should be noticeable but not stand out too much as map readers are expected to search for the map scale when required.
A map scale is typically included on a reference map as again if you remember, a general reference map does not have any one particular purpose. That means you should prepare for the possibility that the user wishes to measure distances on the map. Some thematic maps do not expect that the map reader will be able to measure meaningful distances on the map; therefore, it is appropriate for the map scale to not be included on some thematic maps.
When choosing and designing a map scale there are a few things you must keep in mind. The first is to use round, meaningful numbers on your map scale. Decimal numbers should be avoided on a map scale unless the decimal number is a meaningful and significant interval that you expect map readers to measure. The map scale should be long enough to be useful, but not too long. There are three types of scales that you can use for a map: graphic, verbal, and representative fraction.
Graphic
The graphic scale uses a graphic element, typically a bar or line, to represent a certain distance on the map. The graphic scale bar is often divided at meaningful intervals to assist the map reader in measuring. The graphic scale should show meaningful round numbers and the unit of measure. A major advantage in using a graphic scale is that if the map is ever enlarged or decreased in size the graphic scale will scale accordingly and will always be correct.
Verbal
The second type of scale is the verbal scale. The verbal scale is a sentence that describes the relationship of the distance on the ground to the distance on the map. Again it is important that you relate the ratio which the earth has been reduced in meaningful and appropriate numbers and units. For instance, in the verbal scale example provided, it reads “1 inch on the map equals 20 feet on the ground”. Both units of measure are nice round numbers and are included in an appropriate measurement unit. One inch on the map translates to 20 feet of the earth. It would not be useful if you asked the map reader to measure on the map in feet when the map itself is less than 1 foot wide, and it might also be inappropriate to state the distance on the ground as millimeters, for instance, when a small distance of the map represents miles.
Verbal Scale
One inch on the map
equals twenty feet on the ground
Representative Fraction
The third type of scale is the representative fraction scale. In a representative fraction scale two numbers are written separated by a colon. The number of the left of the colon represents the distance measurement map and a number to the right of the colon represents distance measured on the ground. You can have a representative fraction scale without units as they are shown here.
That means that whatever units were used to measure on the map should be the units used to measure on the ground. In our example a representative fraction of 1 to 20 means that if I measure on the map 1 inch, it represents 20 inches on the ground. You can also have representative fractions that use units.
An example of this would be 1 inch to 20 feet. One important issue to note with both the verbal and representative fraction scale is that they do not scale accordingly if the map is enlarged or reduced.
Representative Scale
1:20
Scale Bar
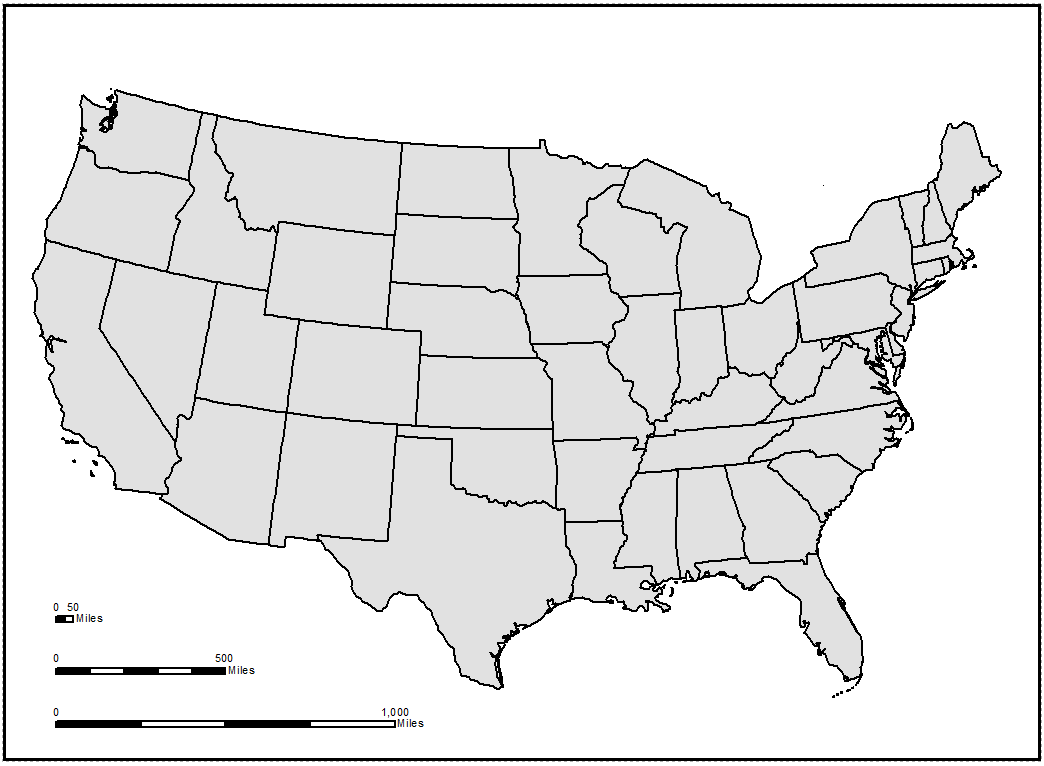
When placing the scale bar on the map layout you should make sure that the scale bar is large enough to be found but small enough to be subtle. Finding the best balance requires experimentation on your map and there is no hard rule. Looking at our example you can see that the top and bottom scale bars are not appropriately sized.
The top scale bar is quite small and is not really useful to the map user when measuring longer distances. The scale on the bottom is too large and it becomes visually dominant on the map. Therefore, the map scale in the middle is considered to be at a reasonable size for this particular map.
Quality Criteria
When creating your map scale you should always make sure that they meet these three criteria. First, the scale units should be meaningful. If you are making a roadmap of Arkansas it would be appropriate to place a scale with units in miles or kilometers. A scale bar in feet would not be appropriate for that scale as people tend not to measure car trips in terms of feet. Additionally, decimal degrees would be inappropriate as it is not a useful linear distance measurement.
Second a scale unit should be appropriate to scale. That means that if you were showing a map of a small neighborhood maybe your map unit should be in feet or meters and not miles. Third, the scale interval should be rounded easy-to-use meaningful numbers. A map scale from the numbers 0 to 23.78 is not easy-to-use or meaningful to many map users. Therefore, if at all possible, you should use nice round numbers.
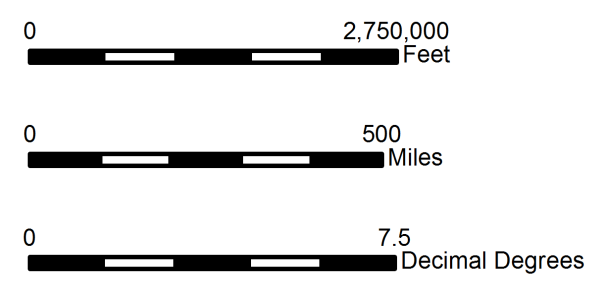
The third criterion related to quality is that the number divisions should divide equally into the scale range. As an example the middle scale bar is from the numbers 0 to 500 miles. There are five divisions in the scale bar and each division represents a distance of 100 miles which is a nice round, meaningful number. If you look at the top scale bar which goes from the number 0 to 2,750,000 feet, there are five divisions and each division represents 550,000 feet which may not be a very useful or meaningful number.
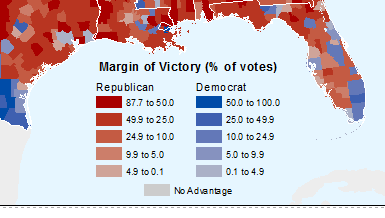
Legend
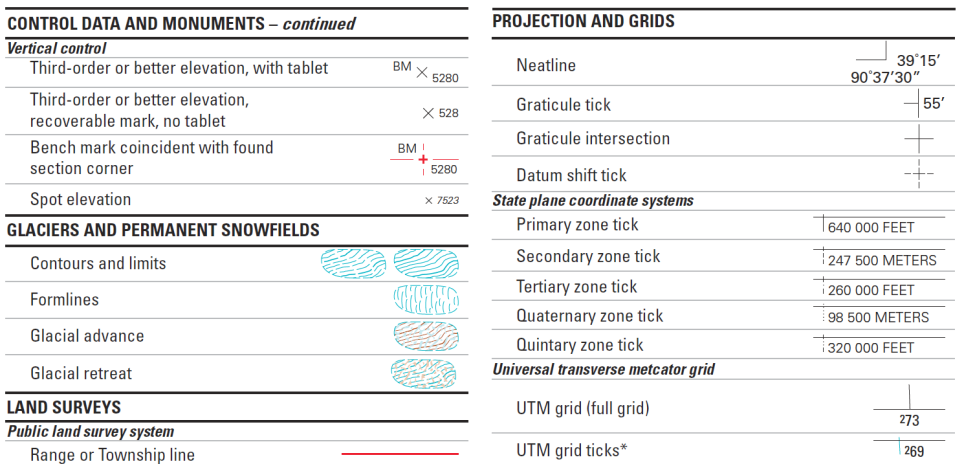
The purpose of the legend is to identify unknown or unique map features succinctly. This means that a map legend does not need to include a representation of all map features that are self-evident such as water features, or roads. However, general reference maps traditionally define all symbols.
When designing a legend you should not include the word “legend” as a map reader knows that it is a legend. Instead you could put some other meaningful text at the top the legend or no text at all if it is not needed. An exception to this is if the audience is not skilled at map reading such as young children. Symbols that represent map features on the legend should be identical to the symbols on the map. If the symbol size is on the map, the legend entry should be the size of the average symbol on the map. If you choose, polygon and line symbols can be represented by irregular shapes instead of just using squares or straight lines.
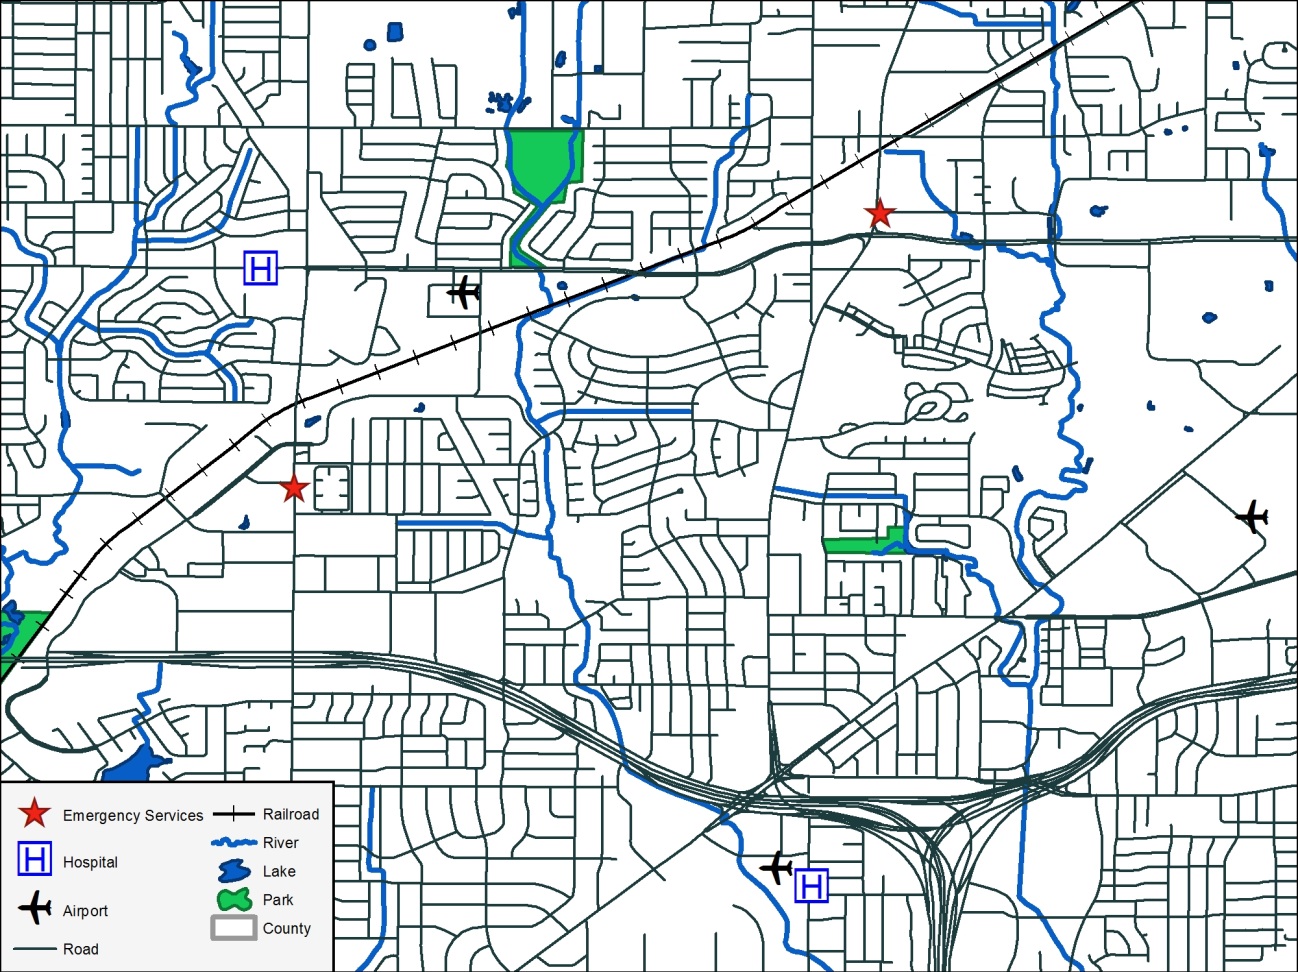
General Reference Map Legend
Take a look at the general reference map legend example. This map legend has two columns of information that are roughly equal in size. Each map feature is identified with a symbol that is identical to the symbol found on the map followed by the name of the map feature to the right of the symbol. On this general reference map legend common features such as lakes, parks, rivers, railroads, and roads are included, where they may not be included on thematic maps. This thematic map legend is for a graduated symbol map.
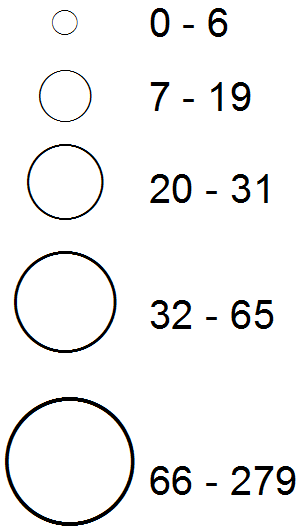
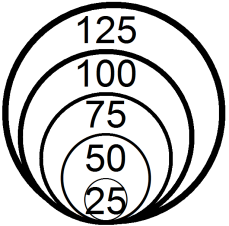
Graduated Symbol Map
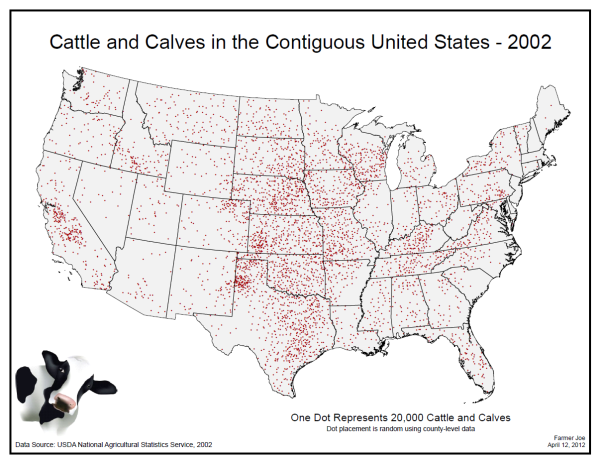
In a graduated symbol map the symbols vary in size as related to the values they represent. Therefore it is important to show a representative size for each value, or range of values, as we wish the map reader to be able to determine the value at those locations based on the size of the circles. The figures below are examples of graduated symbol legends. In Figure 4.16, the Vertical Layout, we see the different size circles which are the same size of the circles shown on the map, followed by the value that each circle represents to the right. In Figure 4.17, the Nested Layout, to save room, the circles are nested inside of each other, and the labels are placed inside the appropriate circle.
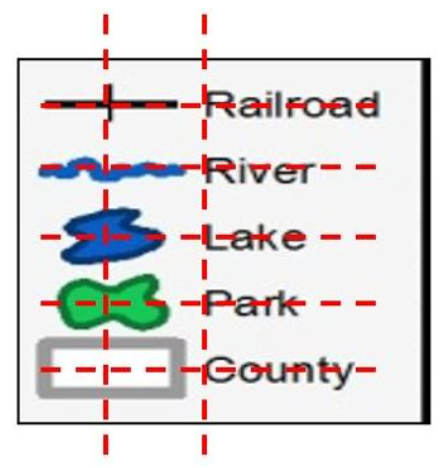
Legend Design
When designing a legend you should take great care to make a legend look well-structured and consistent. There are a few issues you should pay attention to while designing your legend. First, the symbol should be at the left with the description to the right. The symbol should be evenly distributed and spaced from each other and the description. The symbol should be aligned with the descriptions to the right. The symbol should also be horizontally centered.
Last, the descriptions should be left justified in line with each other. Humans are very good at seeing slight irregularities and if a map reader notices any regularity and placement or alignment in your map legend it may diminish the map reader’s trust in your map.
Columns
When designing your legend you can choose to split the legend of multiple columns so that the map legend is to be placed properly on the map or the legend entries can be split into meaningful separate columns. Any decimal numbers on your legend that are smaller than one should have a leading 0. Ranges of numbers are normally separated by a hyphen or the word “to”, however, the word “to” can help reduce confusion when there are negative numbers in the legend.
Headings
A legend may contain headings to meaningfully separate groups of legend entries. Symbols representing a single feature on the map should have a singular description and multiple features with the plural description.
Directional Indicator
The directional indicator is typically a North arrow. The purpose of a directional indicator is to indicate a direction on a map. Map readers are used to most maps showing North as up. Unless you have a good reason to have north pointing anywhere but up you should not buck this trend. North arrows are necessary on a map when North is not at the top of the map and where map readers not familiar with the area on the map.
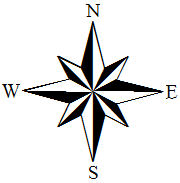
The directional arrow is often not necessary on a small scale map as many map readers are familiar with the orientation of larger landmasses or areas. The North arrow should not be made overly large and should not be placed in prominent locations. If a map reader needs to know the orientation of the map, they are expected to search to find the North arrow. A North arrow may come in many different designs and may show other directions other than North. When you choose a North arrow make sure it is not overly ornate and easy to use and understand.
Indicator Examples
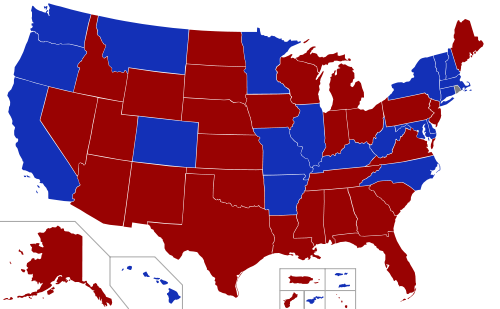
On this qualitative thematic map (Figure 4.21) showing the standard Time zones of the United States of America, notice that there is no North arrow. This is an appropriate choice as most map readers should be aware that North is at the top of this map. A North arrow could have been included on this map which would be fine; however, consideration should be taken to make sure that the North arrow is not visually dominant on this map.
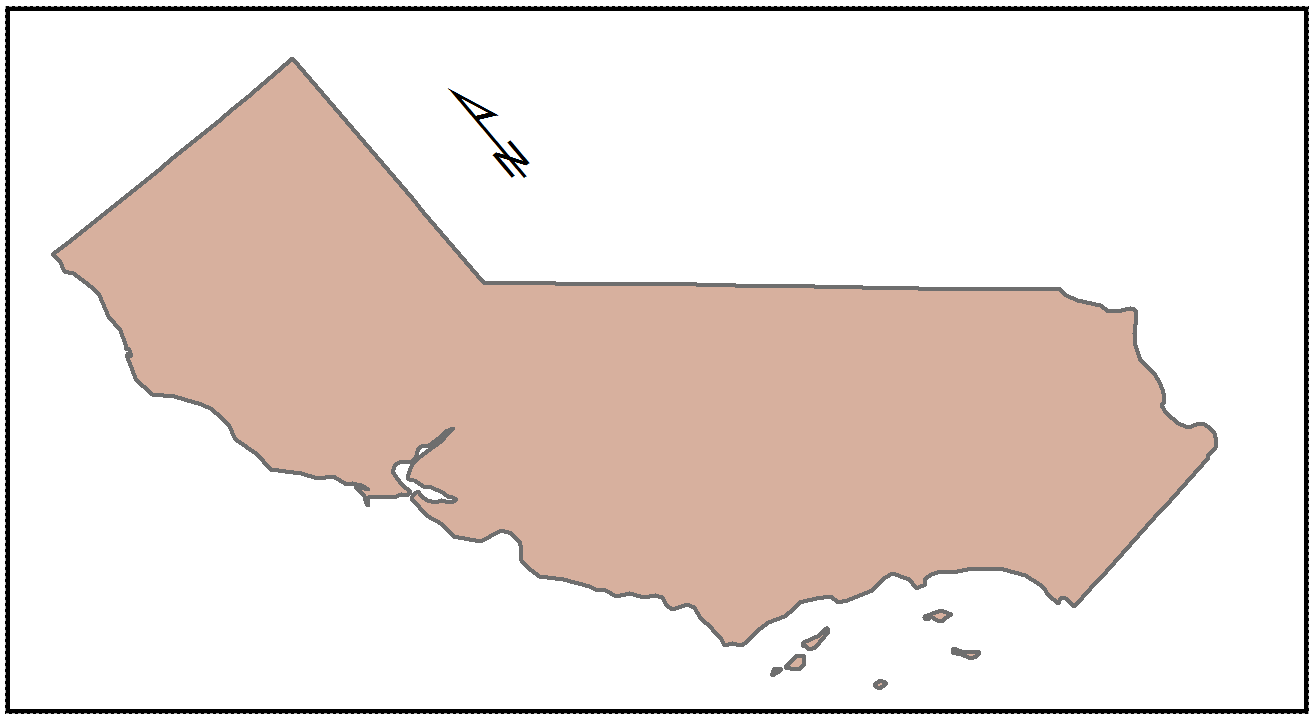
On this map of California, since North is not up, a North arrow is appropriately included on this map.
Label
The purpose of the label map element is to communicate attribute or ancillary information to the map user. A label helps orient the user to the map and the features shown on the map. Review Figure 4.23 for an example of a label map.
Metadata/Credits
The next map element is the metadata, which may be referred to as the credits. The purpose of the metadata is to cite the source of data sets used to create the map. They can also contain the map author’s information, such as their name, and contact information. Metadata should also include the date the map was created and other explanatory information about the creation of the map such as the map projection used.
Metadata is typically placed along the bottom edge of the map and de-emphasized as it is typically not that important for the map reader to notice right away. The metadata should be among the smallest text on the map. If a map reader wishes is to learn more about the details of the map and its data they are expected to search the map for the metadata.
Graticule
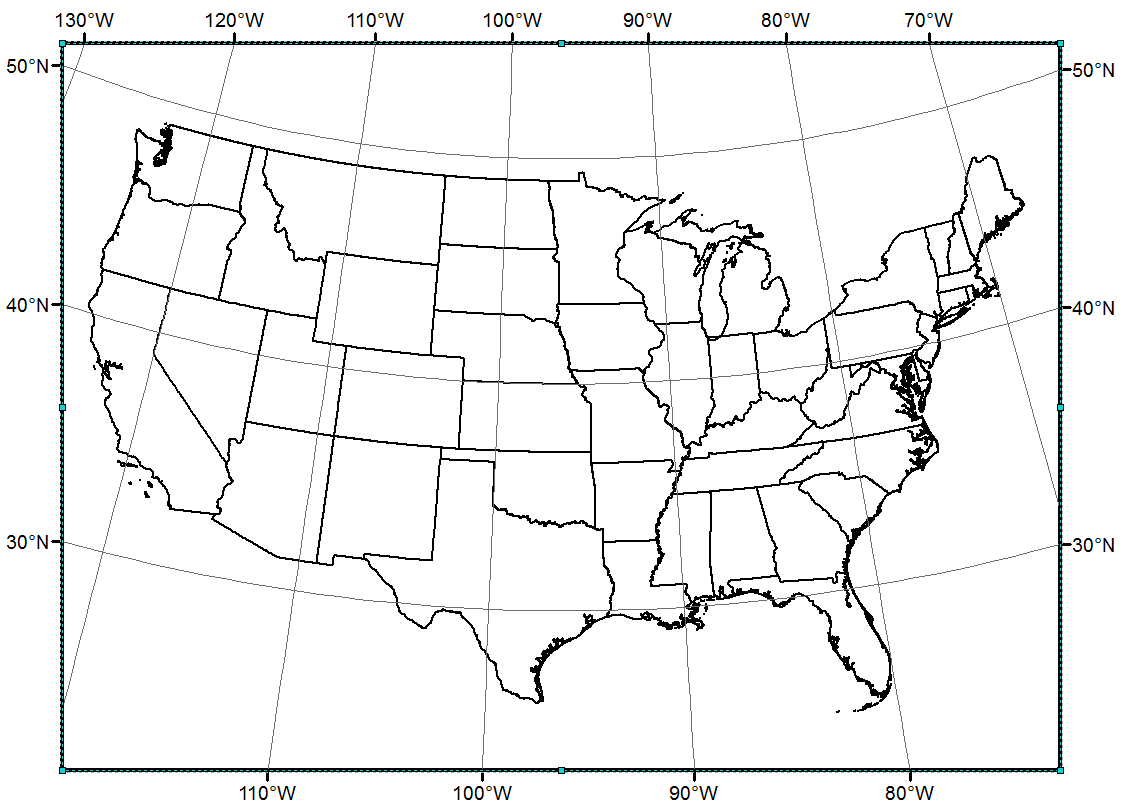
A graticule is a visual representation of a coordinate system or location scheme used on the map. You should include graticule on a map if the map reader will be referencing coordinate locations throughout the map. The graticule should use meaningful divisions and meaningful units. Typically the graticule is omitted from a thematic map as thematic maps wish to convey the spatial distribution of a theme and is not to be used for determining precise locations. Graticules should be reasonably dominant on the map so that it is easy for the map reader to use even when the details of the map may become dense.
Neat Line
The neat line map element serves as a frame around the entire map or individual map elements. The purpose of a neat line is to provide a nice, clean frame for the map. It helps the users find the center of the map which is where the most important map elements should be placed. A map layout may contain multiple neat lines surrounding other map elements should the map elements need a frame helping focus on a map element. The style of the neat line should be simple and subtle and should not be overly ornate. Looking at the example you see a single fixed neat line surrounding the entire map which allows the eye to focus on the center of the map to separate the map from the rest of the page. Figure 4.25 is an example of a very effective neat line serving as a frame.
Ancillary Text and Objects
The final map elements to be covered are ancillary text and ancillary objects. The term ancillary refers to an item that supports another item. In our case the ancillary information is additional information if it provides a greater understanding of the topic of the map.
Examples of ancillary items are text, pictures, sounds, movies, and graphs to name a few. A common use of ancillary information is to indicate the data manipulation that is pertinent to the interpretation of the map. Examples also include additional explanatory information or discussion of special cases or missing data.
Placement
When considering map elements and your map layout you should carefully consider map element placement. In general you should place map elements so that they are positioned and sized in accordance with their importance. You should also strive to reduce white space on the map. This means you should try to fill the available space with useful information and not have any large unused space on the map. If you find that you have a large amount of unused space of a map, perhaps you should bring the neat line in closer, reposition map elements, or consider a new layout altogether. You should also balance the map layout so that map elements are evenly distributed around the map if the map does not feel to be too “heavy” on one side of the map.
Planar and Hierarchical Organization on a Map
The purpose of the map composition is to develop an intellectual and visual structure that the map reader can use to understand the message the map author is trying to get across. A well composed map stresses the purpose of the map through the use of well selected and design map elements. A well-designed map and title directs readers’ attention to the purpose and the primary focus of the map that the author wants the map reader to notice.
A properly composed map will also coordinate base and thematic elements so that the map reader has enough geographic contexts to interpret the focus features on the map. A well-designed map will maintain cartographic conventions that make the map easily accessible and familiar to as many map readers as possible so that they can have an easy time utilizing the map. A properly composed map attains all of this, for the map reader will have the highest possible chance to get the most out of the map and properly understand what the map is trying to convey. When properly designing a map there are two important concepts to consider: the planar organization on the map, and the hierarchical organization on the map.
Planar Organization
There are three aspects of planar organization as they relate to composing a map. These three aspects are balance, focus of attention, and internal organization. After discussing the two centers of an image, this part of the lesson will cover each of these three aspects in more detail.
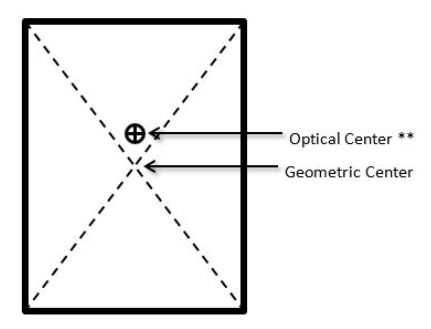
On any image, and specifically a map, there are two centers of the image. The first center is the geometric center. The geometric center is the location that it is exactly half the height and half the width of the image. The optical center is a location that the human eye initially rests on when viewing an image. The optical center is slightly above the geometric center of the image. This is important to know for map composition as it is the first thing you want your map reader to view which is the most important feature on the map. Therefore, it is going to be important that you only place the most important features of your map in the optical center.
Balance
The first aspect of planar organization is balance. Defined, balance provides the visual impact of the arrangement of the map elements. There are two factors to consider related to the balance: weight and direction. Weight refers to the location, size, and shape of the map element of the map composition. Direction refers to the relative location, shape, and subject of the map elements on the map composition.
Weight
When considering weight as related to balance on a map, the visual weight of an object depends on its location on the map composition. Elements at the center of the map composition pull less weight than those off center and off-track. An object in the upper part has more weight than in the lower part of the map. Objects on the right are considered to be heavier than the objects on the left and weight increases in proportion to the distance from the center. Because of all this, it is important that we evenly distribute the weight around the map.
Imagine if the ink on a map weighed a significant amount and you try to place the piece of paper on the tip of a pen. Ideally if you place the geometric center of the map at the tip of the pen the map would balance. If the center of the map does not have as much weight as elements placed around the edges, or one edge of the map has significantly more elements on the other edges, the map would feel off balance to the map reader. Visual weight also depends on the size of the object. Large objects are heavier than small objects. If a large object is placed off center and off-track it will have significant weight and may run the risk of throwing the entire map off balance.
Visual weight also depends on color, interest, and isolation. Related to color red is heavier than blue, white is heavier than black, and bright is heavier than dark. Related to interest, objects of intrinsic interest to the map reader will be considered heavier as they will tend to linger at that portion of the map. With isolation if an item is significantly isolated from other objects, perhaps with a large amount of white space between them, then that object will be quite heavy.
And finally, visual weight depends on shape. Regular shaped objects are heavier than irregular shaped objects. Compact shapes are heavier than those not so shaped. Therefore solid geometric objects such as circles, squares, and triangles are heavier than other geometric shapes such as stars, and +.
Direction
The second aspect of planar organization is direction. Visual direction depends on location. The weight of an element attracts neighboring objects imparting a direction to them. Visual direction also depends on shape. Shapes of objects create axes that impart directional forces into opposing directions. Visual direction depends on subject matter. Objects possessing intrinsic directional forces impart visual direction on other elements. Consider some examples of direction based on location, shape, and subject matter.
In these direction examples we see two circles, a large black circle and a small black circle. If we consider location and its effect on direction we can see that in Figure 4.27 (Right) where the large circle is in the upper right-hand corner the smaller circle is the lower left of the large circle, that figure seems to have a direction pointing in the top right-hand corner. This is because our eyes naturally started the visual center of the image and then it gets pulled to the small circle and finally to the large circle which imparts a direction to us.
For Figure 4.27 (Left), since a large circle is in the center of the image and the small circle is close but does not have as much weight, this image does not seem to have an overarching direction as our eyes do not wander too far from the center. It would consider shape of objects, in these cases, the circle does not have any intrinsic directional force; therefore, we are relying on location to determine direction. Had the circles been replaced with triangles, or lines, those shapes have axes that can impart a directional force.

White Balance
Also related to balance is the use of white space on the map. White space refers to a blank space on the map that does not have an element placed at the location. In general, white space should be minimized in a map; however, white space can be useful to visually separate or group elements. Excessive amounts of white space can also make the map visually unbalanced. Consider the white space around South America on these nine images in Figure 4.28. The center image has South America centered on the geometric and visual center. Because of this, even though there is as much white space on the images and the images around it, South America interrupts the white space and allows for the image to have doubts.
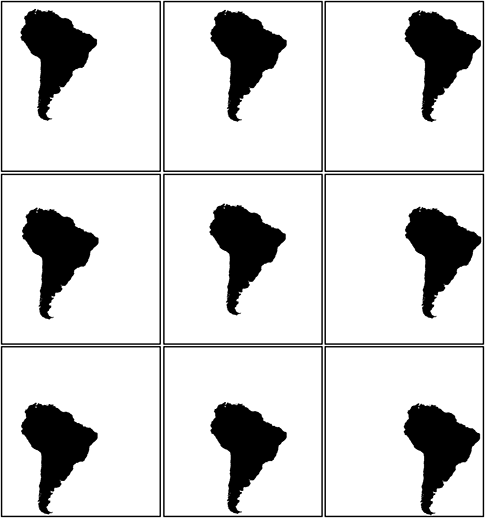
If you look at the other eight images where South America is placed along the edges, significant amounts of white space are exposed and each individual image seems to be visually off-balanced which is not desirable. In order to counteract all the white space there are two options: reduce the size of the neat line to bring it in tighter around South America, or add map elements to fill in the white space.
Focus of Attention
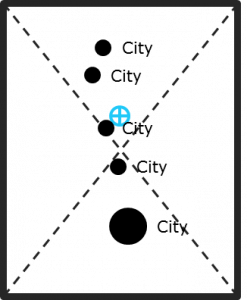
The second aspect of planar organization is the focus of attention of the map reader. When a map reader first looks at a map they follow a path from the upper left corner to lower right corner passing through the optical center. Because of this, it is important to put the focus of the map at around the optical center and not skewed to one side of the optical center. If you look at Figure 4.29 and 4.31, Figure 4.29 has a location of the cities well to the left of the optical center.
As a user focuses on the optical center, the important map features are to the map reader’s periphery and may be overlooked. In Figure 4.31 the locations of the cities are placed very close to the optical center and commanded the attention of the reader.

Internal Organization
The third and final aspect of planar organization is the internal organization of the map. You should strive to have order on all of your maps. An ordered map has an overall structure that defines place and function of every detail on the map. Without strong internal organization a map element may look out of place and awkward. We should strive for creating a structure of all elements, or a place for everything and everything in its place. We will now discuss how to create a strong, structured internal organization.
Contrast is the first method that we can use to assist in defining an internal organization on our map. Contrast leads to differentiation of objects in our map. Contrast can help distinguish between important and unimportant parts of a map as well. Contrast can be achieved through line, texture, value, detail, and color.
There are two types of line contrast: line character and line weight.
Line Character
Line character is the nature and pattern of the line. By varying the nature of the line, we can differentiate the lines from each other which will allow us to create contrast. Examples of ways which we can change the nature of the line is to dot the line, or dash-dot the line, or dash the line, or some other variation thereof.

Line Weight
We can also modify the line weight. Users can see half a point difference in line thickness pretty easily. Maps with multiple line thicknesses focus attention, are lively, and provide structure to the map. Users can see 0.5 point difference. The focal features of the map can have a thick line weight which will allow the user to differentiate from the background features.

Elements of a map may include a neat line, map body, graticule, insets, title, legend, label, ancillary text, ancillary object, scale bar, directional indicator, and metadata.
The name of a map.
The main focus of the map and should be visually dominant in every case; contains the features important to the message of the map.
Represents a region of interest within a geographic context and the surrounding area is cut off often by a neat line.
A region that is disconnected from neighboring regions.
Secondary map areas, each encased within their nearline; often display the primary mapped area in relation to a larger area.
A small ancillary map that is at a smaller scale than the map body.
The ratio between the distance between two locations on a map and the corresponding distance on Earth’s surface.
Uses a graphic element, typically a bar or line, to represent a certain distance on the map.
A sentence that describes the relationship of the distance on the ground to the distance on the map.
Two numbers are written separated by a colon. The number of the left of the colon represents the distance measurement map and a number to the right of the colon represents distance measured on the ground.
A bar representing a certain distance on the map; often divided at meaningful intervals to assist the map reader in measuring.
Provides users with information about how geographic information is represented graphically. Usually consist of a title that describes the map, as well as a clear definition of various symbols, colors, and patterns that are used on the map.
The symbols vary in size as related to the values they represent.
A vertical arangement of figures or other information.
A title at the top of a section.
Typically a North arrow. The purpose of a directional indicator is to indicate a direction on a map.
A word or words used to specify a point on the map; it's purpose is to communicate attribute or ancillary information to the map user.
Purpose is to cite the source of data sets used to create the map. Can contain the map author’s information, such as their name, and contact information; should also include the date the map was created and other explanatory information about the creation of the map such as the map projection used.
A visual representation of a coordinate system or location scheme used on the map.
Border boxes that are placed around individual map elements; must occur within the frame line.
An item that supports another item.
Provides the visual impact of the arrangement of the map elements. There are two factors to consider related to the balance: Weight and direction.
