
7.2 A Very Short History
The history of mapping is long, rich, and complicated. There are hundreds, if not thousands, of books on the history of mapping and maps. Here, we look at a very general outline; note that we are only looking at a few representations, and are focusing primarily on European and North American maps. There are long histories of mapmaking in most regions of the globe. In thinking about maps, it helps to distinguish between literal maps, which were meant to show actual things and places, and figurative maps, which show conceptual or imagined places.
Early Maps (25000 BCE+). People have probably been scratching maps into the dirt with sticks for longer than they have been using words. The figure below shows a few maps made in around 600 BCE (Before Common Era) that traces relationships between cities and mythical places and ideas.
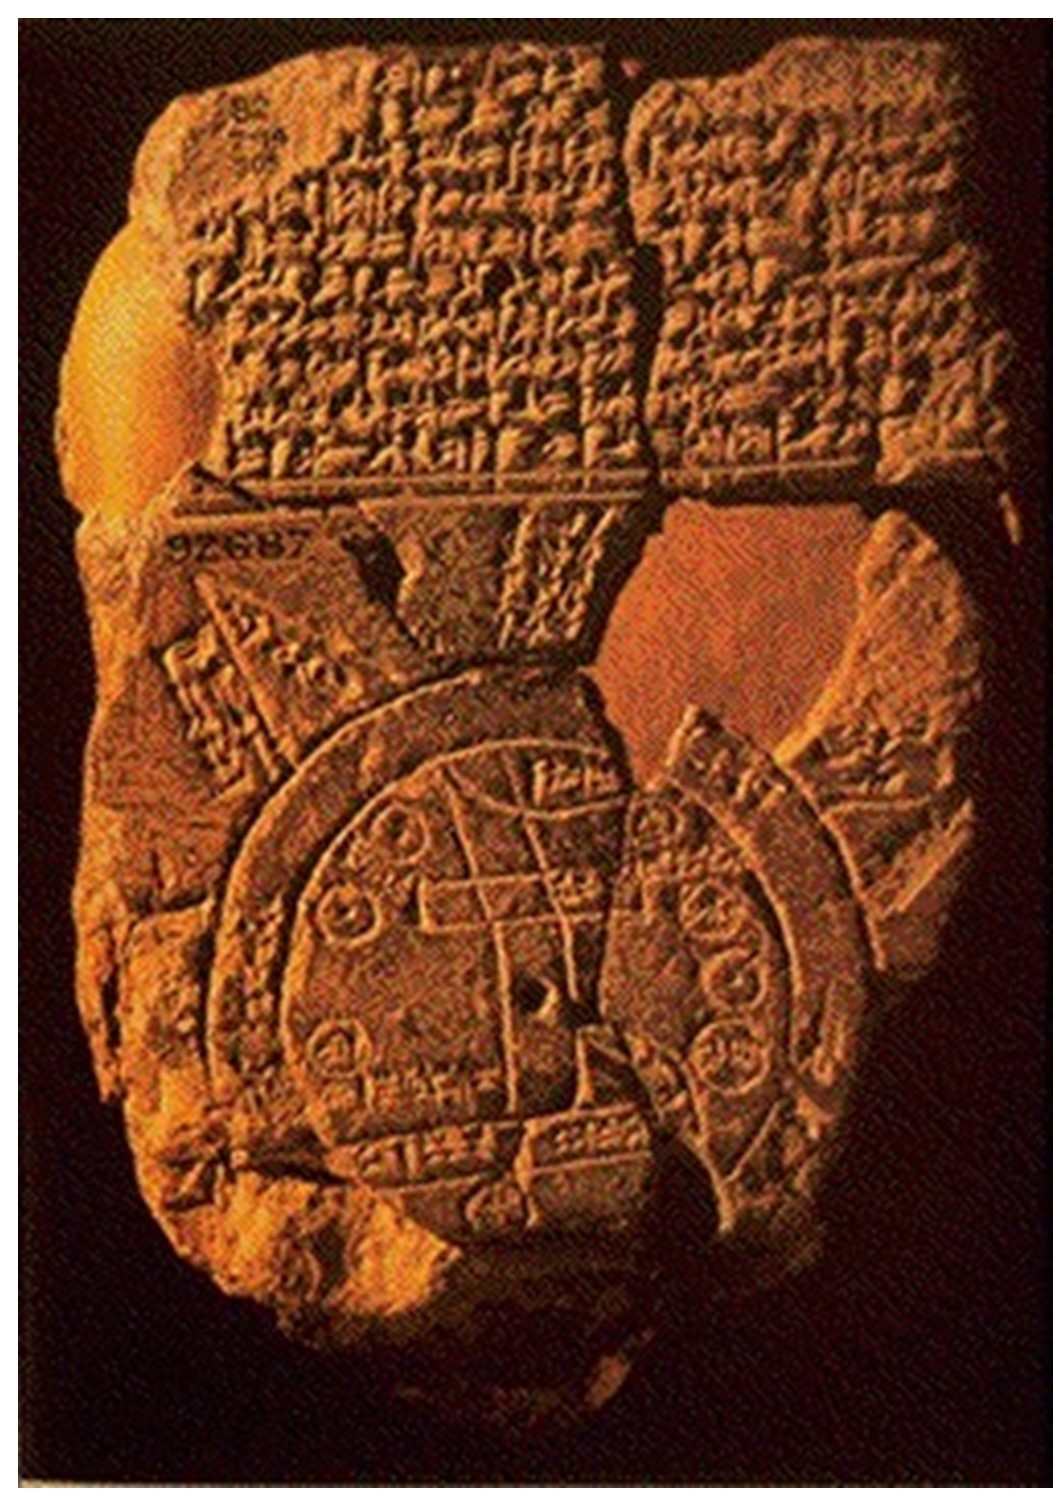 Babylonian Map of the World. This map traces relationships between cities and mythical places and ideas (~600 BCE). [1]
Greeks (800-100 BCE). The Greeks were producing fairly high-quality and accurate (so, literal) maps of the region around the Mediterranean Sea and were among the first peoples to discover earth’s circumference. Eratosthenes (276-195 BCE) is widely credited for this achievement.
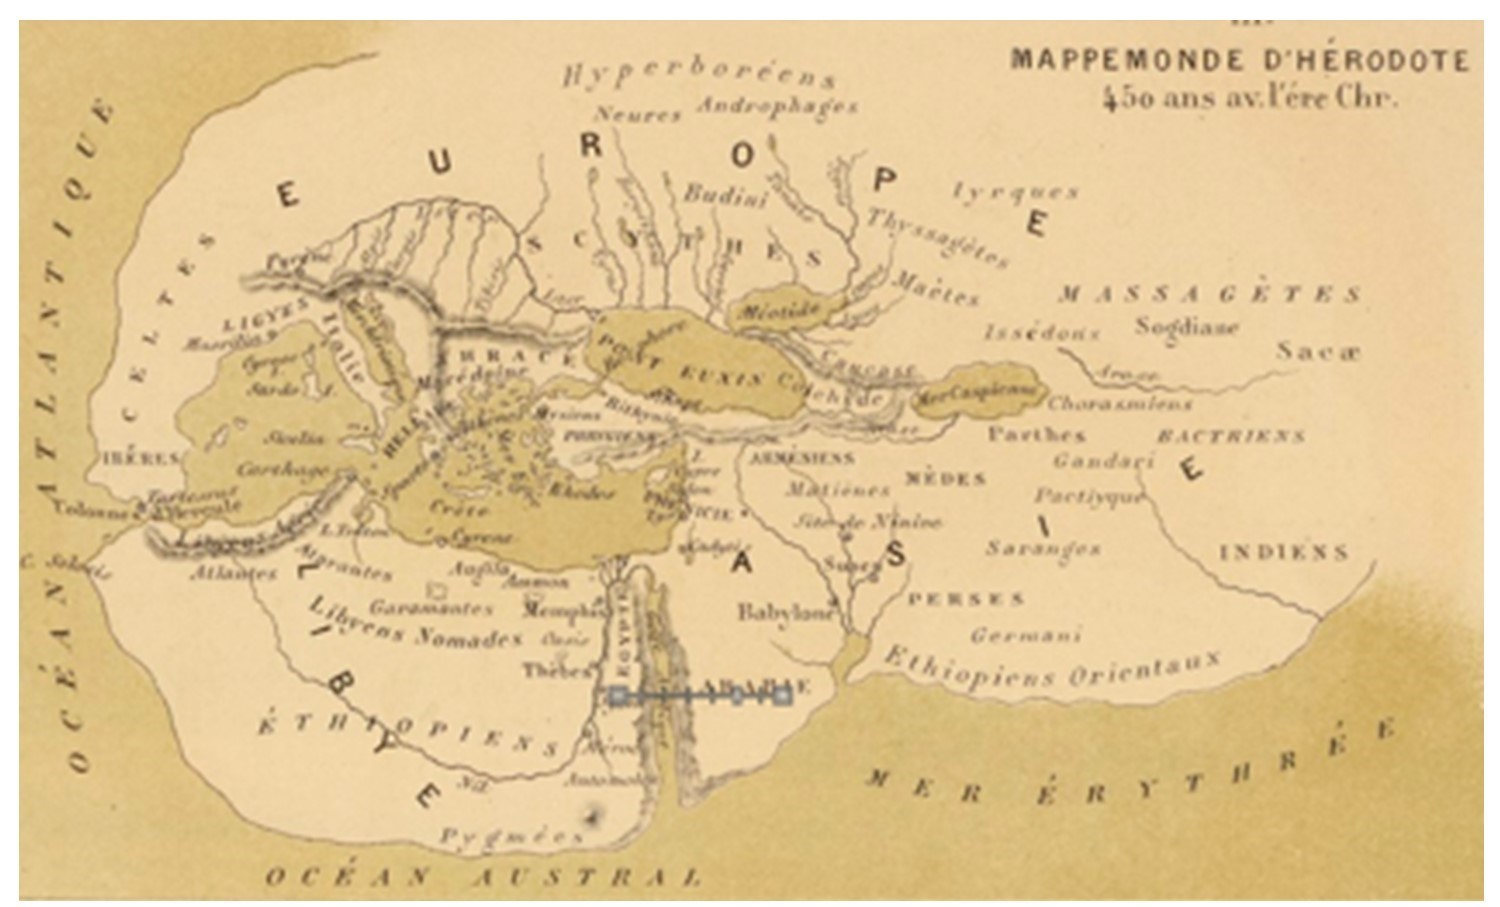 World According to Hecataeus. Reconstruction of the literal map that the Greeks produced of the Mediterranean Region. [2]
Medieval Maps (1100-1400s). In Europe during the Dark Ages, maps took a turn towards the figurative, often in aid of advancing religious viewpoints of the world. An example is the T and O Map below, where the T is the Mediterranean, the Nile, and the Don Rivers dividing the continents of Asia, Europe, and Africa; and the O represents the encircling ocean. Given its religious significance, Jerusalem was generally placed in the center of the map and because the sun rose in the east, Paradise (representing the Garden of Eden) was considered as being in remote Asia. This map captures aspects of reality, such as the relative locations of water bodies and continents, but is a step back from past maps in terms of realism.
 T and O map. This map by Isidore of Seville where the T is the Mediterranean, the Nile, and the Don Rivers dividing the continents of Asia, Europe and Africa; and the O represents the encircling ocean. [3]
At this time, non-European cartographers were developing literal maps. Abu Abdullah Muhammad al-Idrisi al-Qurtubi al-Hasani as-Sabti, or simply Al-Idrisi (1100–1165), was an Arab geographer, cartographer, and Egyptologist who lived in Sicily at the court of King Roger II. He traveled the Mediterranean world and developed advanced maps of the world, like the one here.
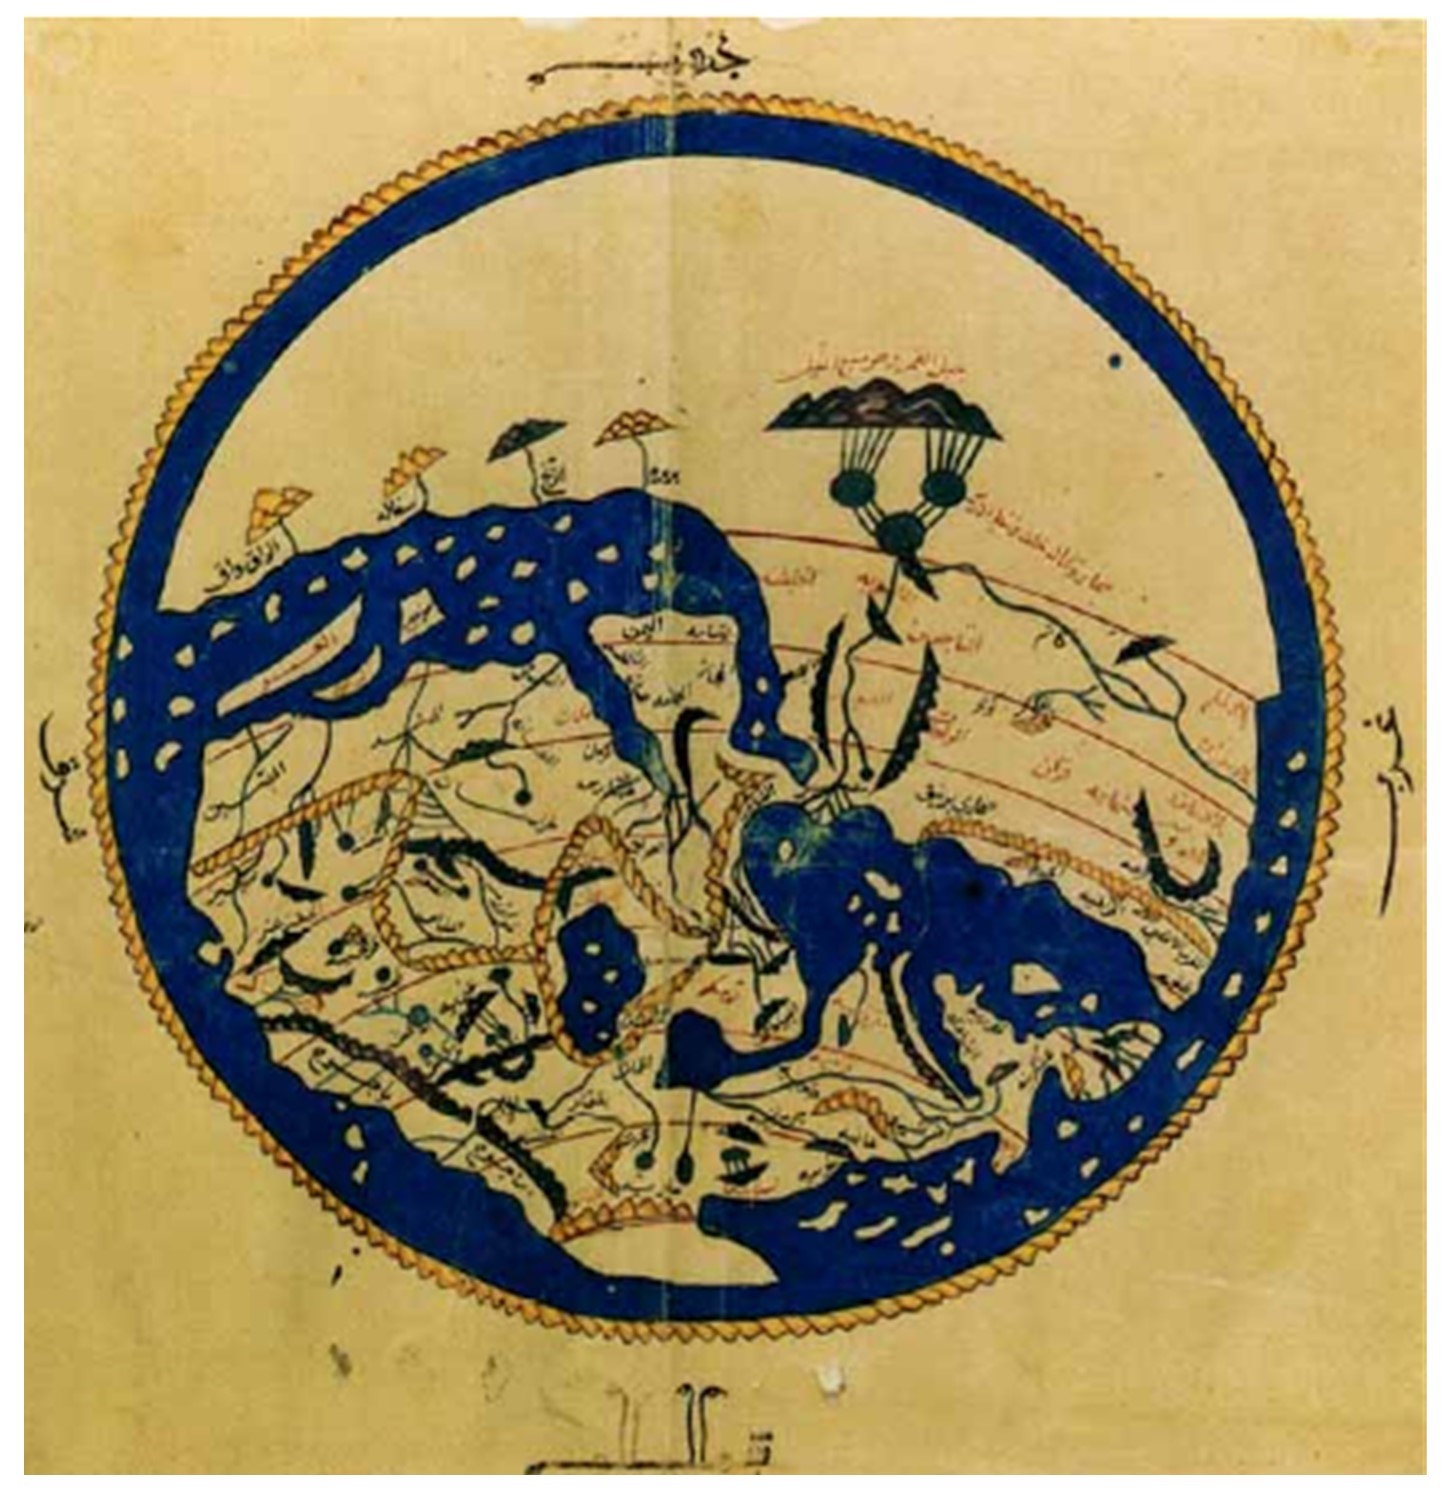 Al-Idrisi’s map of the world. Al-Idrisi was a geographer, cartographer and Egyptologist who lived in Sicily at the court of King Roger II. He traveled the Mediterranean world and developed advanced maps. [4]
Age of Exploration (late 1400s+). European countries embarked on a period of exploration in the 1400s that reshaped the world. Many nations from around the globe had intrepid explorers before this time, but this period saw a rapid increase in maps being made for the explicit purpose of navigation. Chinese cartographers were developing maps for navigation but also as a way to understand history, as below, where Ch’üan Chin and Li Hui developed the Map of Historical Emperors and Kings and of Integrated Borders and Terrain.
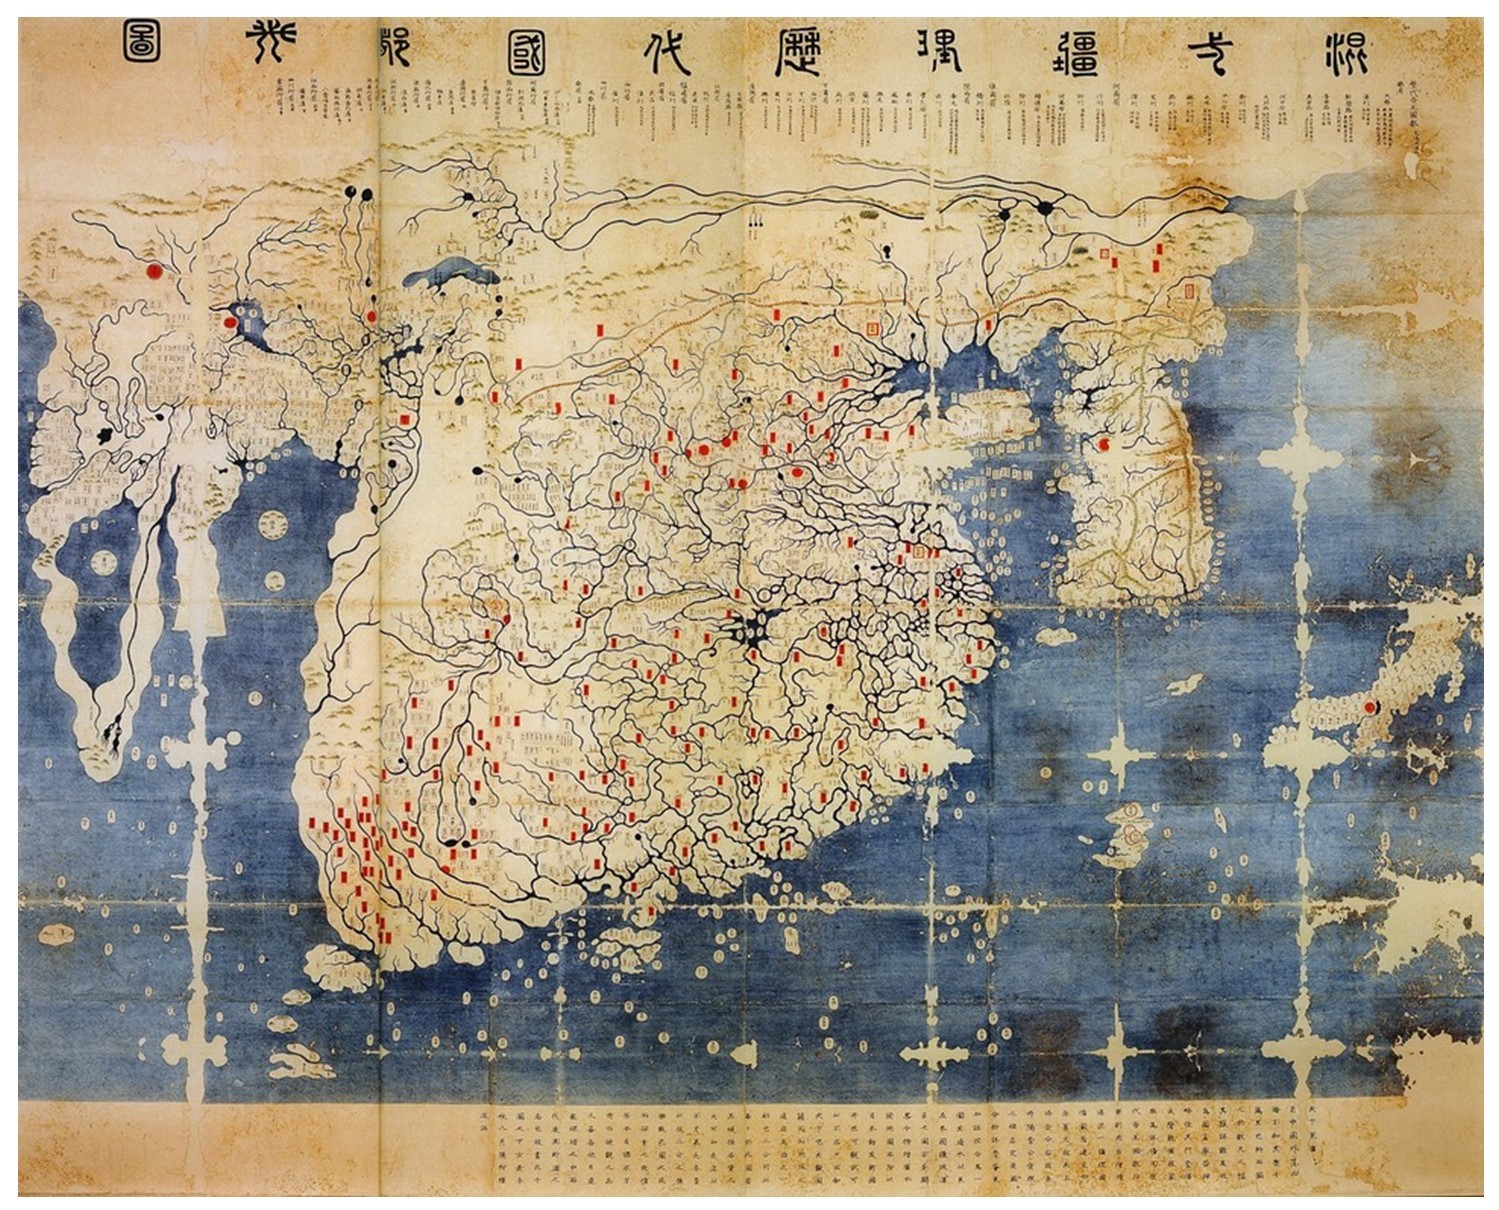 Historical map. Chinese cartographers developed this map in 1402 of historical empires, borders, and terrain. [5]
The Cantino Map, shown below, is one of the earliest surviving maps showing Portuguese discoveries around the world. It is named after Alberto Cantino, who successfully smuggled it from Portugal to Italy in 1502. The Cantino Map, like others of its kind at the time, held military, political, and economic significance. Given that such maps were being used to sail ships and lay claim to places, mapping became more concerned with providing literal and accurate representations of reality.
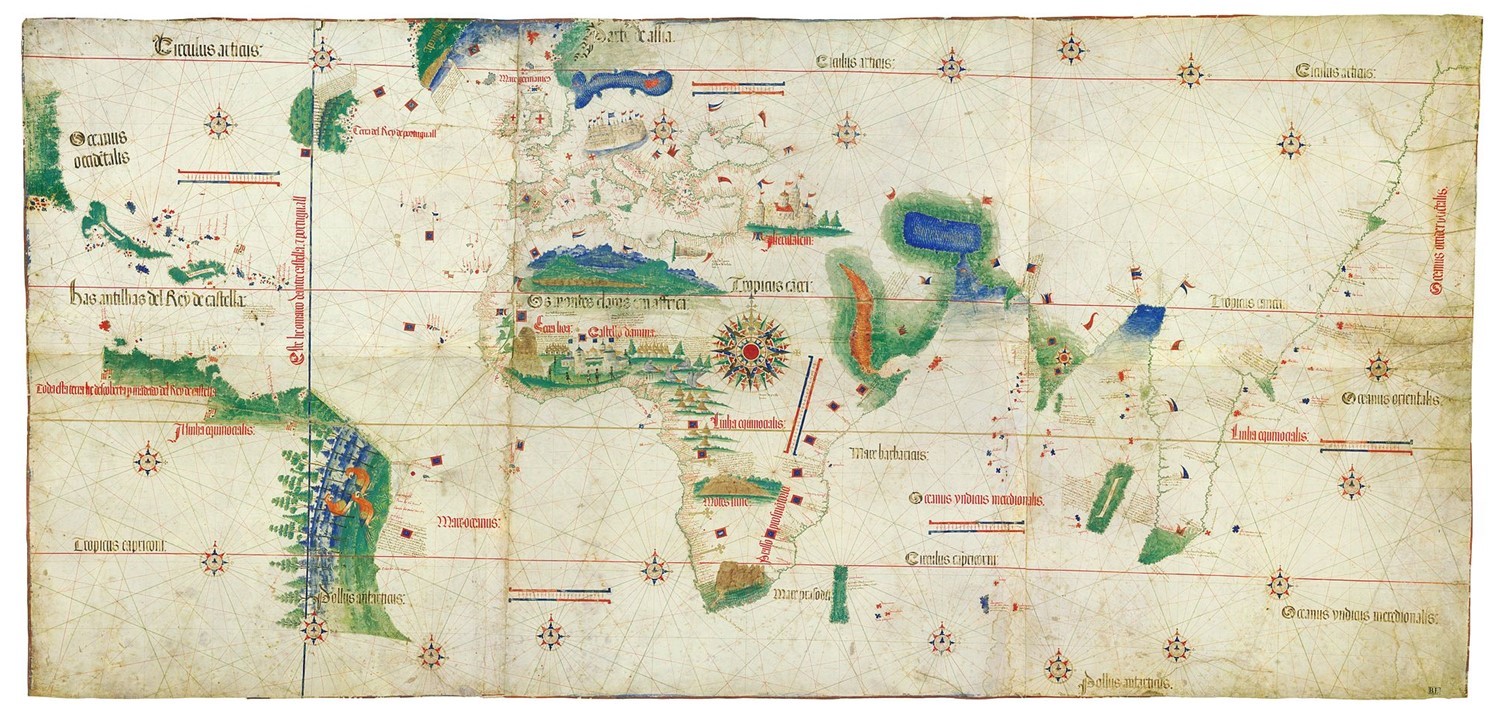 Cantino Planisphere. Portuguese discoveries as of the year 1502. [6]
Thematic Mapping (late 1600s+). From the 17th century onward, more people made thematic maps. As discussed above, thematic maps focus on a particular idea or theme, as opposed to serving multiple goals as a reference map. The map below shows travel flows out of Dublin and was one of the first maps designed to convey a sense of flow or movement, namely, where the width of lines was proportional to the number of passengers traveling by rail.
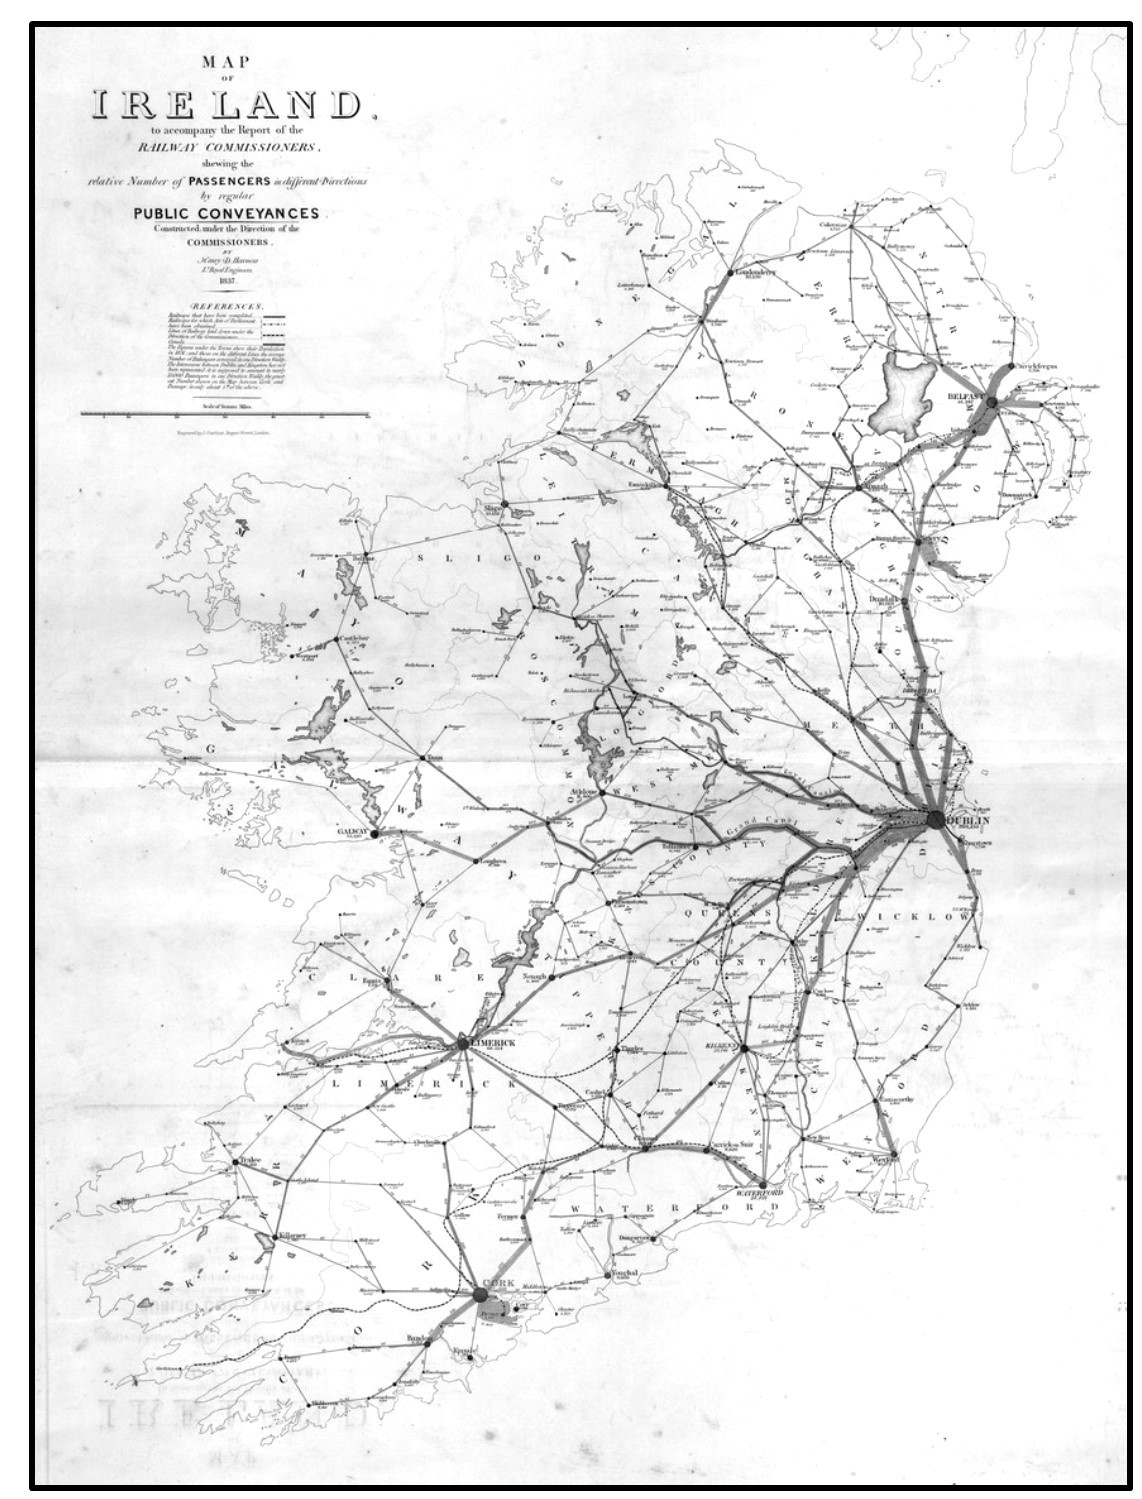 Rail flows out of Dublin. One of the first maps that conveys a sense of flow or movement (1837). The width of the lines are proportional to the number of passengers traveling by rail. [7]
Analytical Mapping (1800s+). Related to thematic mapping is analytical mapping, where maps are used to explore the role of location and space to answer questions. One of the most interesting early examples of analytical mapping was the case of John Snow, an English physician. He investigated the outbreak of cholera in London in 1854. At the time, no one knew it was a water-borne disease. Dr. Snow spoke with residents and determined that many of the afflicted were drawing water from a public well in Broad Street. He established that people with the disease were clustered around the pump and convinced the authorities to discontinue its use. Dr. Snow is credited as being among the first scholars to consider how a spatial pattern could result from a specific process and to produce maps about his findings.
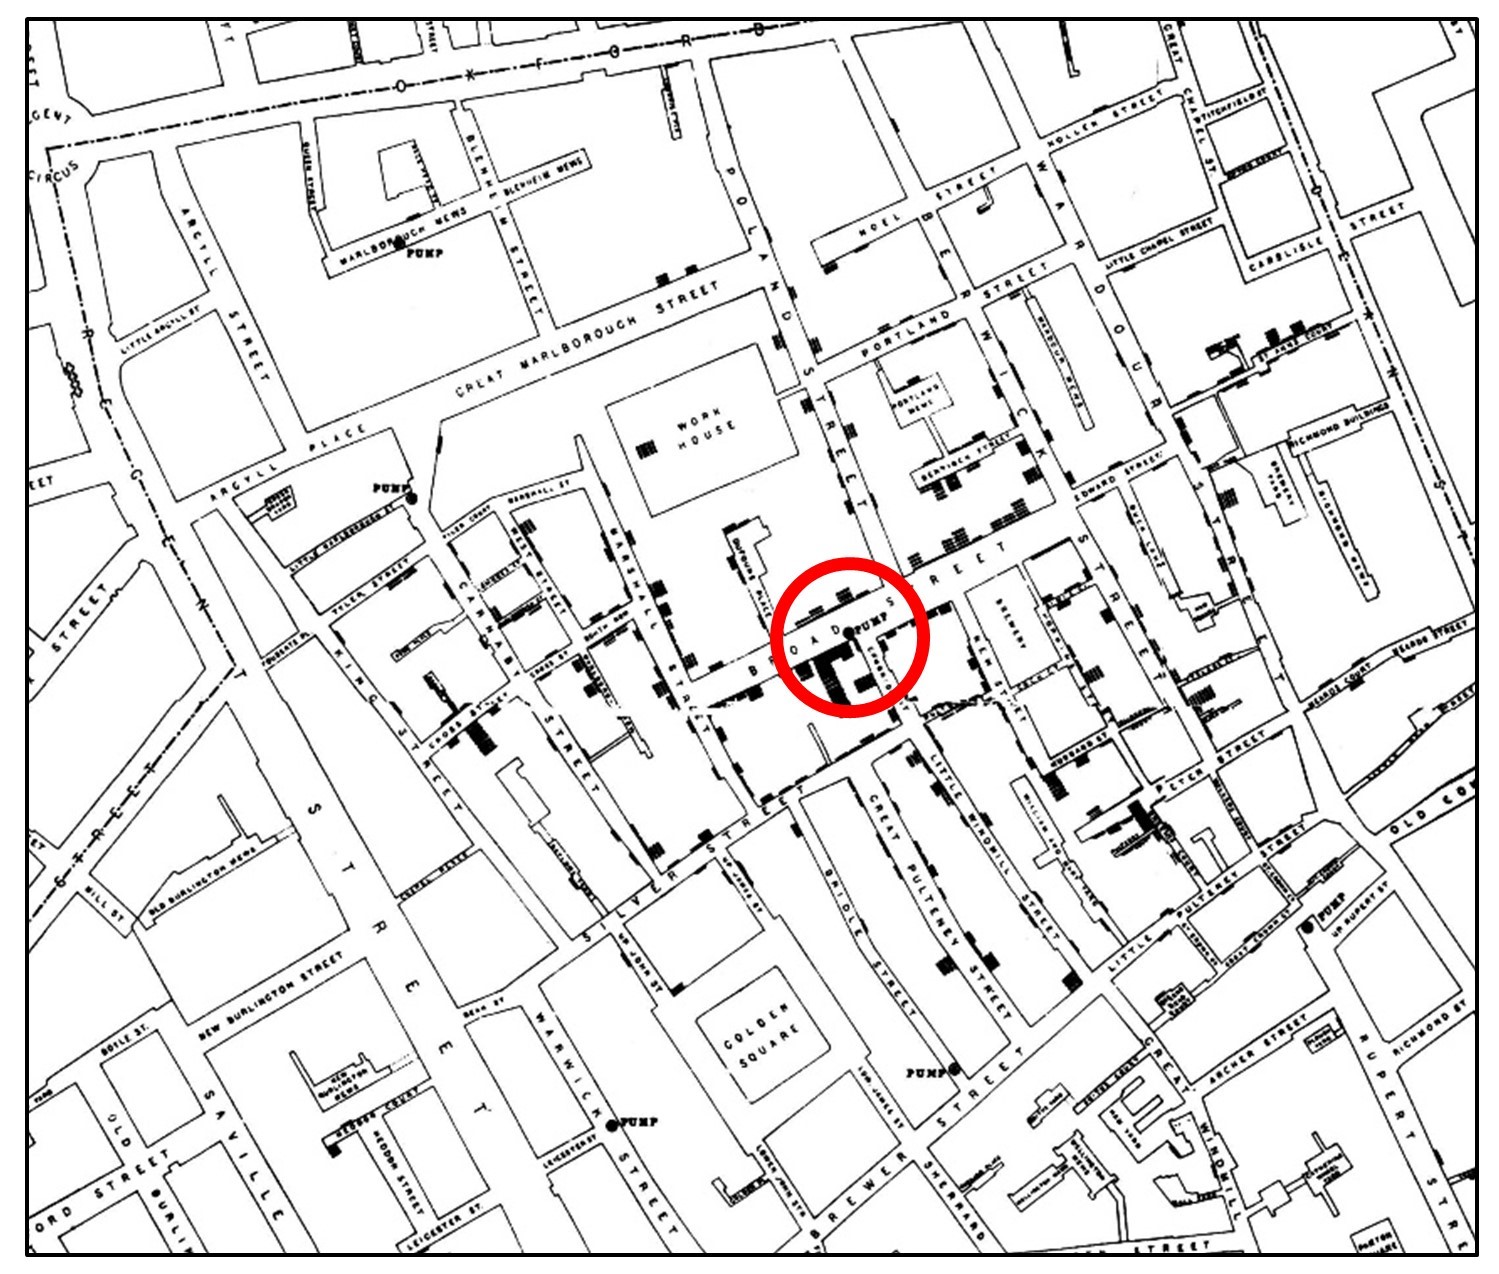 Snow’s map of cholera. John Snow developed this 1855 map to investigate a cholera outbreak. The Broad Street Pump is circled in red. [8]
Geographic Information Science (1960s+). The advent of computing in the 1940s and 1950s led quickly to the foundation for the use of computers in mapping. A Geographic Information System (GIS) is a computer system used to store, display, and analyze spatial information. The field concerned with this use of computers became known as Geographic Information Science (GIS) and has become synonymous with mapping for many practitioners, although technically Cartography is considered the art and science of making maps. As we examine later in the text, GIS can be used to make some truly terrible maps while a cartographer can make beautiful and useful maps using a variety of approaches. GIS excels at bringing together many layers of data for a location and conducting a sophisticated analysis.
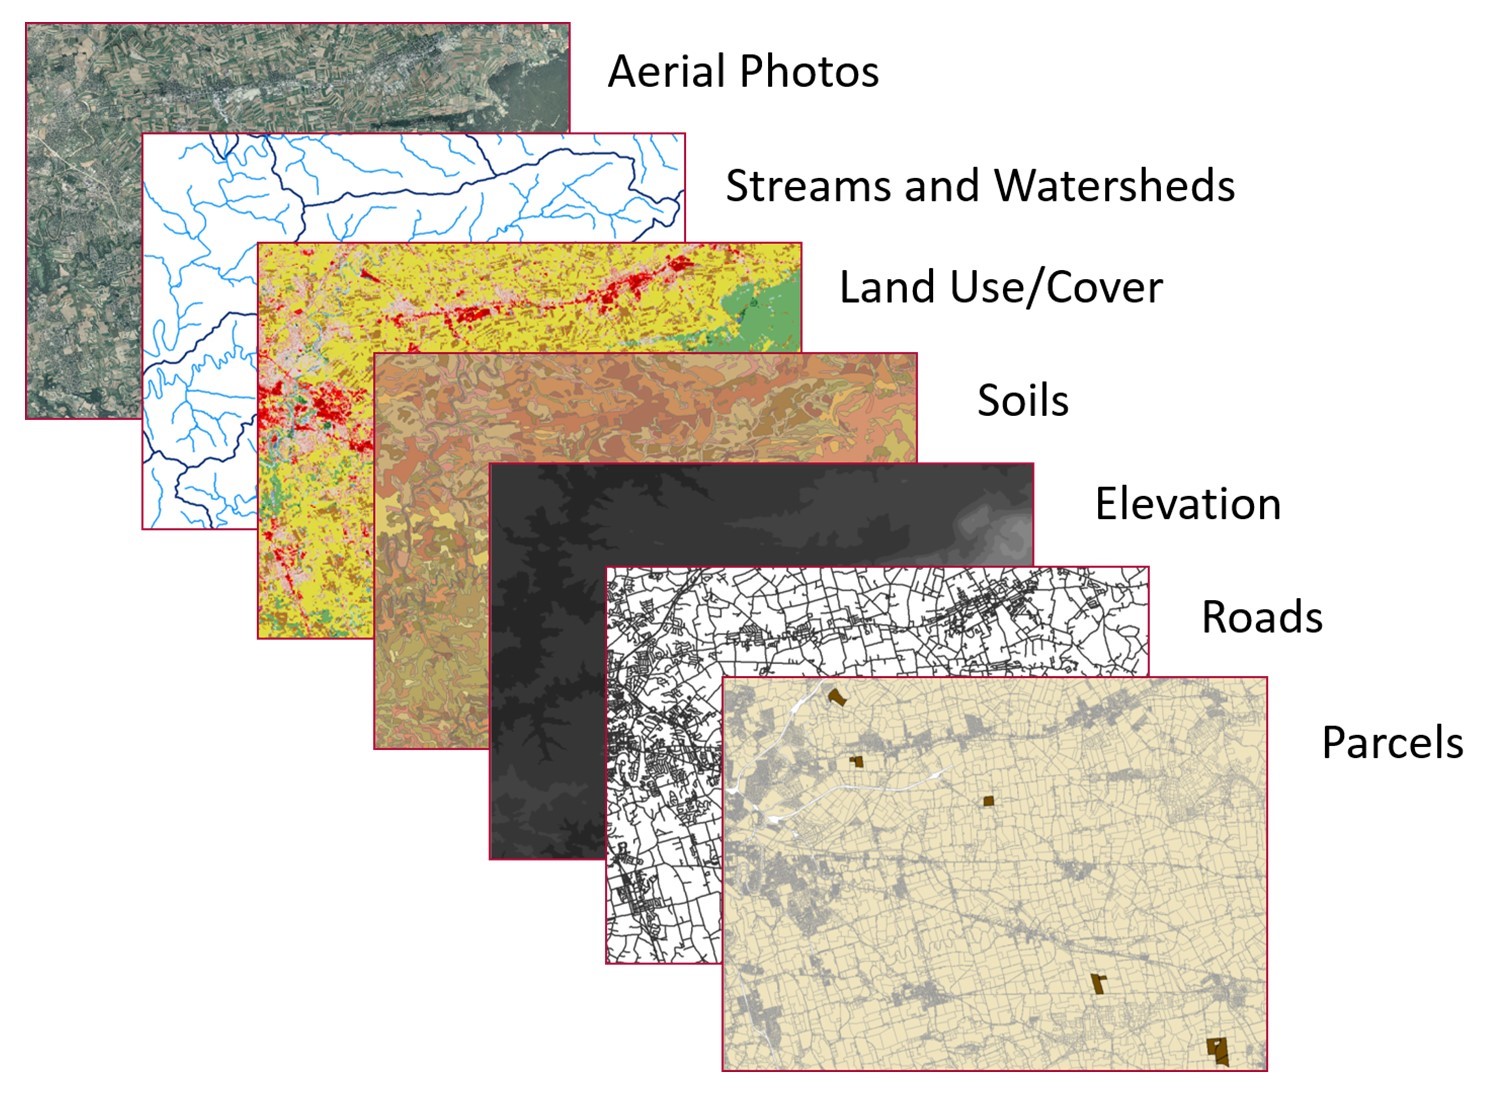 GIS layers. These maps show attributes for part of the state of Wisconsin, United States. Geographic information systems are very helpful in that they allow investigators to store, manipulate, and analyze data on a large variety of phenomena. [9]
- CC-BY Jessie Siebold (2012); used with permission http://www.myoldmaps.com/maps-from-antiquity-6200-bc/title-babylonian-world-map/ ↵
- CC-BY Jessie Siebold 2012; used with permission. http://www.myoldmaps.com/maps-from-antiquity-6200-bc/109-herodotus/ ↵
- Public Domain. By Isidore of Seville. File was extracted from another file: Etimologías - Mapa del Mundo Conocido.jpg, Public Domain https://commons.wikimedia.org/w/index.php?curid=164605 ↵
- CC BY-NC-SA 4.0. Jessie Siebold, used with permission. http://www.myoldmaps.com/early-medieval-monographs/219-al-idrisi-world-maps/ ↵
- CC BY-NC-SA 4.0. Jessie Siebold, used with permission http://www.myoldmaps.com/late-medieval-maps-1300/untitled.html ↵
- CC BY-NC-SA 4.0. By anonymous Portuguese (1502) - Biblioteca Estense Universitaria, Modena, Italy, Public Domain, https://commons.wikimedia.org/w/index.php?curid=26117950 ↵
- CC BY-NC-SA 4.0. Adapted from Atlas to accompany 2d report of the Railway Commissioners Ireland 1838. https://digital.ucd.ie/view/ivrla:45724 ↵
- Public Domain. John Snow; Published by C.F. Cheffins, Lith, Southampton Buildings, London, England, 1854 in Snow, John. On the Mode of Communication of Cholera, 2nd Ed, John Churchill, New Burlington Street, London, England, 1855. https://commons.wikimedia.org/w/index.php?curid=2278605 ↵
- CC BY-NC-SA 4.0. Steven Manson, 2015 ↵
Meant to show actual places with as much accuracy as possible.
A map that shows fictional locations, usually not scaled to accuracy.
Maps concerned with a particular theme or topic of interest, and how things are distributed across space.
A map that is easy to find patterns or trends with using data.
Uses computers and satellite imagery to capture, store, manipulate, analyze, manage, and present spatial data. Sometimes referred to as geographic information systems.
