
9 Warm-up Activity
Wanqing Liu
About Audiogram & Hearing loss
An audiogram is a graph or chart that measures hearing sensitivity, which also shows the result of hearing test. Its X axis represents frequency (or pitch) measured in hertz(Hz), and its Y axis represents loudness (or volume) measured in decibels(dB).
The frequencies on the audiogram start at the lower frequencies (or deeper pitches, such as a dog barking or the sound of a electric saw) on the left and move to the higher frequencies on the right (such as birds chirping or bells ringing); similar to keys on a piano. Moving from top to bottom on the audiogram measures loudness in decibels (dB). The further down on the graph, the louder the sound needs to be in order to be heard.
All the letters of the alphabet except /q/,/w/, /x/, and /y/ are within the speech banana. Also within the speech banana are the letter combinations /th/, /ch/, /sh/, and /ng/. Those letter combinations can be difficult for deaf and hard-of-hearing people to hear and understand. One use of the speech banana is to help visually understand what sounds are not audible.
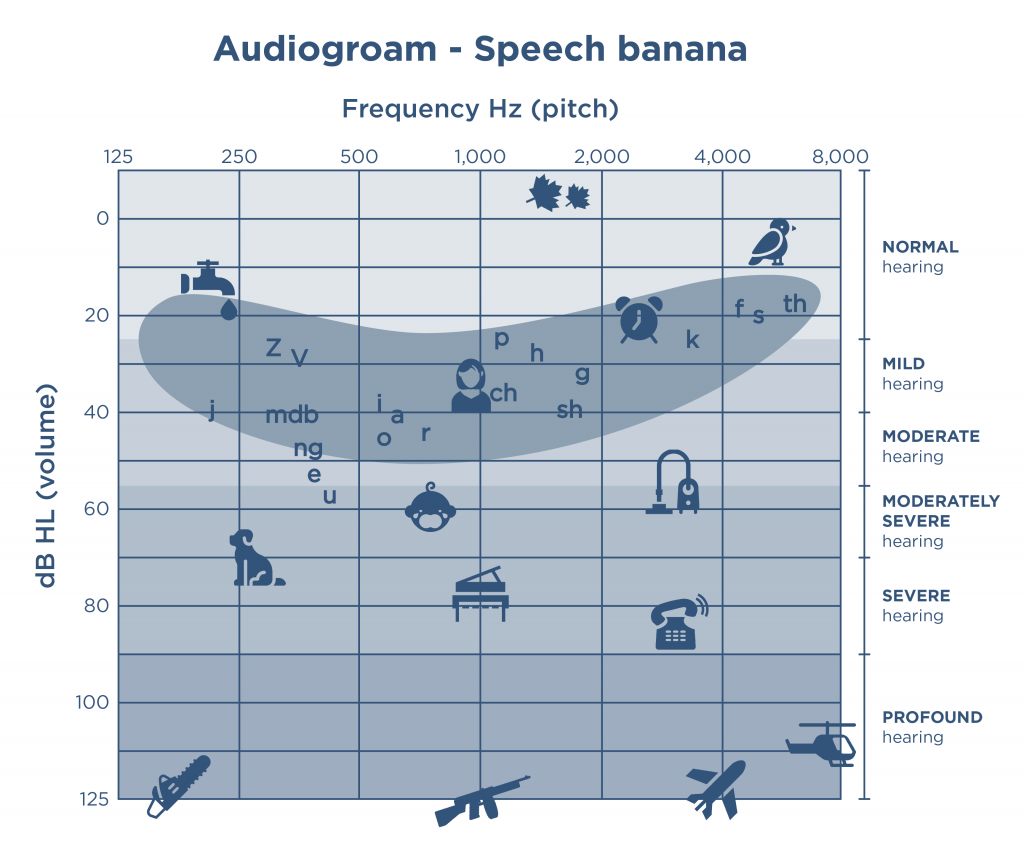
Pic 1 Audiogram - Speech Banana
In the audiogram above, normal hearing ability is represented in the first blue shaded area above the 25-dB line. If your threshold symbols fall in this area, your hearing ability is considered within normal limits. Any symbols below that area, however, indicate hearing loss at those frequencies. Hearing loss is often classified as slight, mild, moderate, moderate-to-severe, severe or profound. They will also describe the pattern of your loss, generally as flat, sloping or rising. Moreover, it can be single-sided(unilateral) or both-sided(bilateral).
How Will Music Sound If Some Frequencies Are Lost?
If you are curious about this question, just play the matching game below!
The four processed audios are made according to the data in the graphs below:
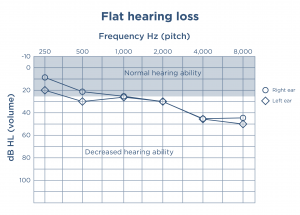
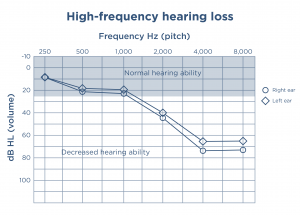
Pic 2 Audiogram - Flat Hearing Loss Pic 3 Audiogram - High-frequency Hearing Loss
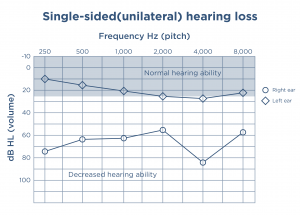
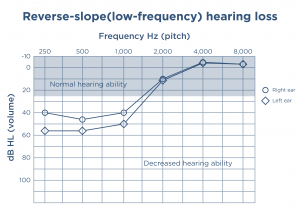
Pic 4 Audiogram - Unilateral Hearing Loss Pic 5 Audiogram - Reverse-slope Hearing Loss
Warm-up Activity – Matching Game
Please listen to the following audios and match them to different types of hearing loss.
*In order to protect your hearing, after listening to processed audios(Type A to D), please first lower your headsets volume before listening to the original one, then you can adjust it to a suitable level.
Original version
Type A
Type B
Type C
Type D
Drag your choices into the blank boxes to answer.
Each box can only contain one choice.
References
Berke, J. (2020, January 27). The Speech Banana in an Audiogram [Blog post]. Retrieved from https://www.verywellhealth.com/what-is-the-speech-banana-on-a-hearing-test-1048455#citation-2
Morz, M. (2020, March 10). Understanding your audiogram results [Blog post]. Retrieved from https://www.healthyhearing.com/report/52516-The-abc-s-of-audiograms
