2.3 From Junk Science to Theory
Alfred Wegener died in 1930 on an expedition in Greenland. His ideas of moving continents seemed destined to be lost to history as a fringe idea. As discussed in the previous chapter, Continental Drift suffered from two main flaws: a lack of a convincing mechanism and scientists did not understand the seafloor between the continents. However, these issues would soon change. In the 1950s, the world had found itself with new technologies developed from the World War II era that could now open fascinating new possibilities for exploration and science. The scientific community would soon be surprised to learn that much Wegener’s “pseudoscience” actually had a strong basis in fact!
Mapping the Ocean Floors
The use of submarines and sonar particularly redefined how we thought of our ocean floor. Beginning in 1947, sonar was adapted by researchers to map the ocean floor, which was very poorly understood. With the new advances in this technology, it was possible to determine the bathymetry, or three-dimensional rises and falls in elevation of the seafloor.
Marie Tharp was the first to make a detailed map of the ocean floor. This map revealed the Mid-Atlantic Ridge, a basaltic feature in the middle of the Atlantic ocean. This underwater feature is actually the longest mountain chain on our Earth, measuring around 10,000 miles! In addition to its astonishing length, there were several other strange features discovered about the Mid-Atlantic Ridge: it had relatively little sediment, which indicated it was younger than the surrounding oceanic crust, and most underwater earthquakes originated along the ridge [2]. What was happening here?
MARIE THARP: THE WOMAN WHO MAPPED OCEANS
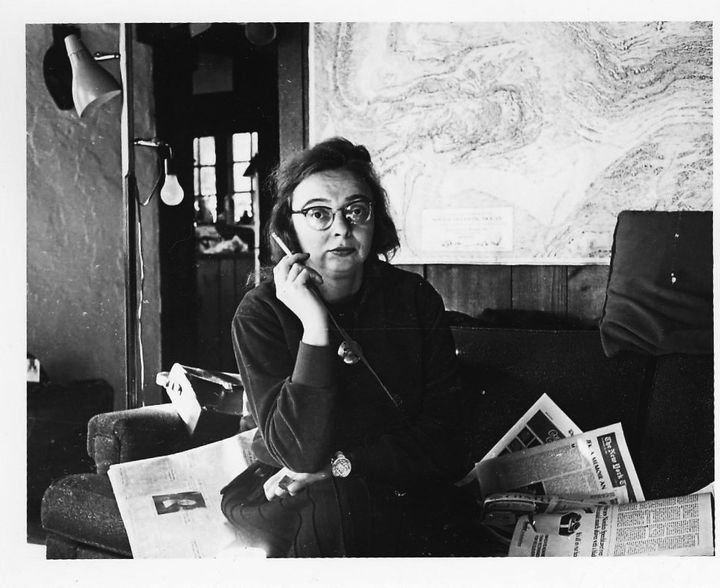
In the 1940s, women were commonly excluded from science, but the absence of men in academia during World War II opened a path forward for one woman who would fundamentally change how we thought about our planet. Marie Tharp earned a Masters degree in Geology during the war, but could not find many job opportunities similar to her male counterparts. Nonetheless, in the early 1950s, she volunteered to take on the tedious and painstaking task of drafting maps of the Atlantic ocean from sonar data collected aboard research vessels. Tharp herself could not go on these expeditions as it was still believed that women brought bad luck along sea voyages, but she created the maps at the famed Lamont-Dohert Observatory at Columbia University, where she worked for her colleague Bruce Heezen [11]. Early in this process, she noticed that the feature called the Mid-Atlantic Ridge actually appeared to have all the features of a deep, rifting valley:
“When I showed what I found to Bruce, he groaned and said, ‘It cannot be.It looks too much like continental drift.’ At the time, believing in the theory of continental drift was almost a form of scientific heresy. Almost everyone in the United States thought continental drift was impossible. Bruce initially dismissed my interpretation of the profiles as ‘girl talk.'” (Tharp, 1999 [12])
Nevertheless, Tharp persisted in collected evidence for her hypothesis, and she eventually convinced Heezen, who soon after championed the idea that the Mid-Atlantic Ridge was firm evidence that seafloor spreading was occurring. When her maps were published, they played a key role in shifting the attitudes of the scientific community toward accepting seafloor spreading as scientific fact. For decades, Marie Tharp was not acknowledged as the author as of the seafloor maps as Bruce Heezen published their work under his name only, although she was not bitter and enjoyed a lifelong friendship with him. Since their initial publication in 1957, Marie Tharp’s maps are still regarded today as being extraordinarily sophisticated [11,12]. View a brief video displaying those maps below!
In the 1960s, scientists were able to make magnetic measurements of the seafloor. The basaltic rock in the oceanic crust contains iron-rich minerals such as magnetite, and once iron cools as a solid, it aligns with the Earth’s magnetic field toward the North Pole. The Earth’s magnetic field creates flux lines surrounding the magnetic north and south poles (like a bar magnet), which are both close to the Earth’s rotational north and south poles. Our planet’s magnetic poles will reverse every couple hundred thousand years (and don’t worry, it is unlikely to harm us!). As a result, the Earth’s magnetic North sometimes becomes the South Pole. Rocks rich in iron record these changes! For example, iron-rich crust produced continuously for a million years will indicate the poles flipping back and forth when carefully measured. These often appear as alternating stripes.
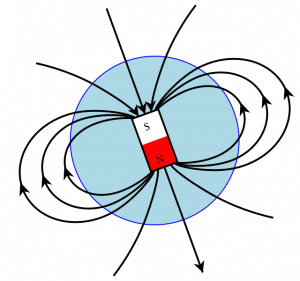

Scientists knew all of this already by the 1960s, but when they measured the magnetic anomalies at the Mid-Atlantic ridge, they found something strange – instead of finding one set of stripes indicating pole reversals in the rocks, they found two nearly identical sets of symmetrical stripes!
Seafloor Spreading
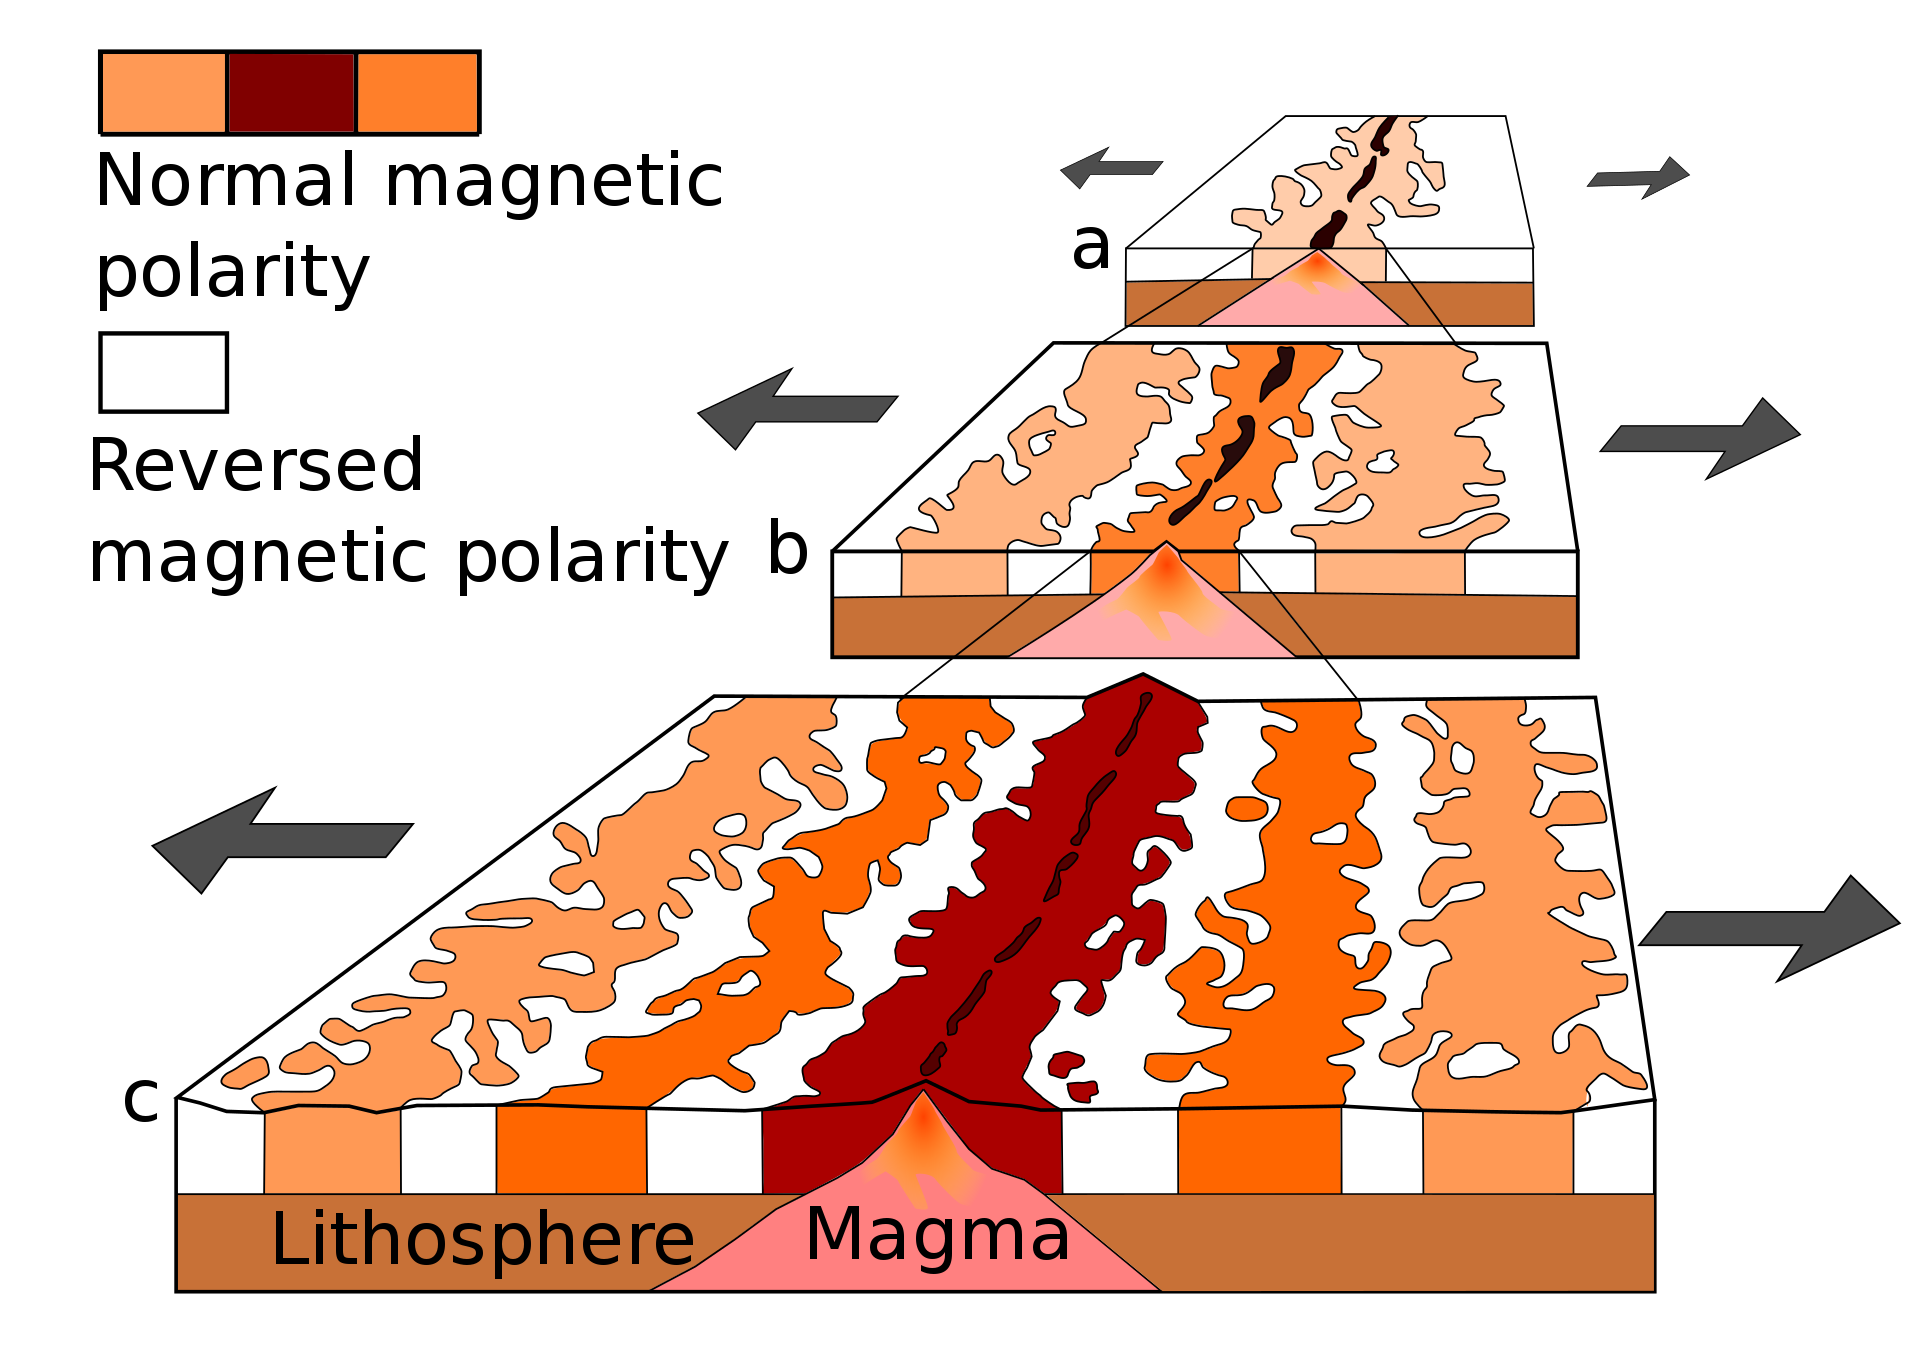
Together with previous observations of the Mid-Atlantic Ridge, these symmetrical magnetic stripes were interpreted as evidence for a new idea called seafloor spreading, which was first proposed by the geophysicist Harry Hess in 1960. The basic idea behind seafloor spreading was that regions such as the Mid-Atlantic Ridge were areas where brand new oceanic crust was created. Magma from the Earth’s mantle would push upward to the crust and surface, where it would cool. Once cooled, that new crust would displace the older crust by pushing it outward and to the side – new oceanic crust would spread from these locations.
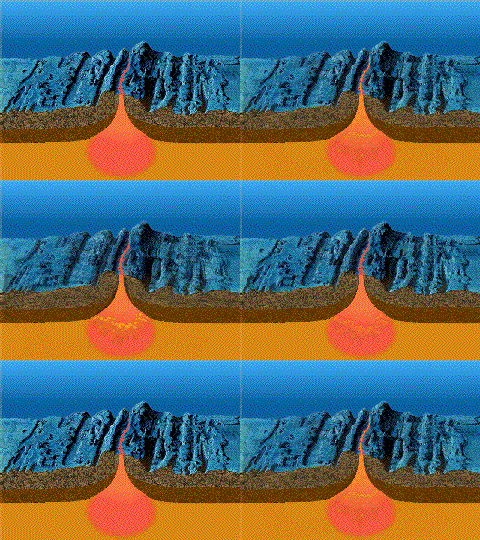
If brand new crust was being formed at the Mid-Atlantic Ridge, it explained why there was no sediment at the location, and earthquakes would also be expected because the region would be a place of active geologic activity. Moreover, this idea addressed the magnetic striping anomalies. Cooling iron minerals would orient toward the geomagnetic North pole as the brand new crust formed at opposite sides of a spreading center; hence, two sets of magnetic stripes would also be expected (see below image).
But what happens when Earth keeps growing new crust? Surely this process can’t occur indefinitely! The seafloor spreading hypothesis found an answer for this problem as well. In the process of mapping the seafloor for the past decade, trenches extending miles deep were found bordering some of the continents. Therefore, it made sense that old crust might be pushed far toward these trenches, where it would eventually descend back into the mantle. It turned out that the Seafloor Spreading hypothesis was the missing puzzle piece that had eluded Alfred Wegener a generation earlier. Wegener’s Continental Drift hypothesis did not have a realistic mechanism in which the continents might move, but as it turned out, Wegener was looking at the wrong thing!
Active Planet
Shortly after convincing evidence for seafloor spreading was brought to light, the scientific community realized that it had made some serious misassumptions about the planet. Wegener’s Continental Drift hypothesis saw a revival, this time with seafloor spreading as the primary mechanism to explain the movement of our continents over millions upon hundreds of millions of years.

The synthesis of these two ideas together transformed into the theory of plate tectonics, which was put forward by the Canadian Geophysicist John Tuzo Wilson in 1966. This theory states that the Earth’s solid crust is divided into multiple parts, some large and some small. These parts slowly ride over the more pliable mantle and geological features and hazards result when they interact with one another.
Plate tectonics was a unifying theory in that it not only explained the movement of continents, the formation of deep ocean trenches and long ocean ridges, but it also could tell us why we observe volcanoes and mountains and feel earthquakes. It was a fundamental paradigm shift in how large scale processes on the planet can cause very small-scale effects!
Wegener did not get all of plate tectonics correct. In addition to proposing the wrong mechanism for this process, he believed that only the continents moved on the planet while the oceans remained in place. As it turned out, the Earth’s crust as a whole moves as a rigid plate. A plate can include both oceanic and continental crust or either. The rigid material that makes what we call the Lithosphere, which is divided into a dozen major and several minor tectonic plates across the world, as shown below:
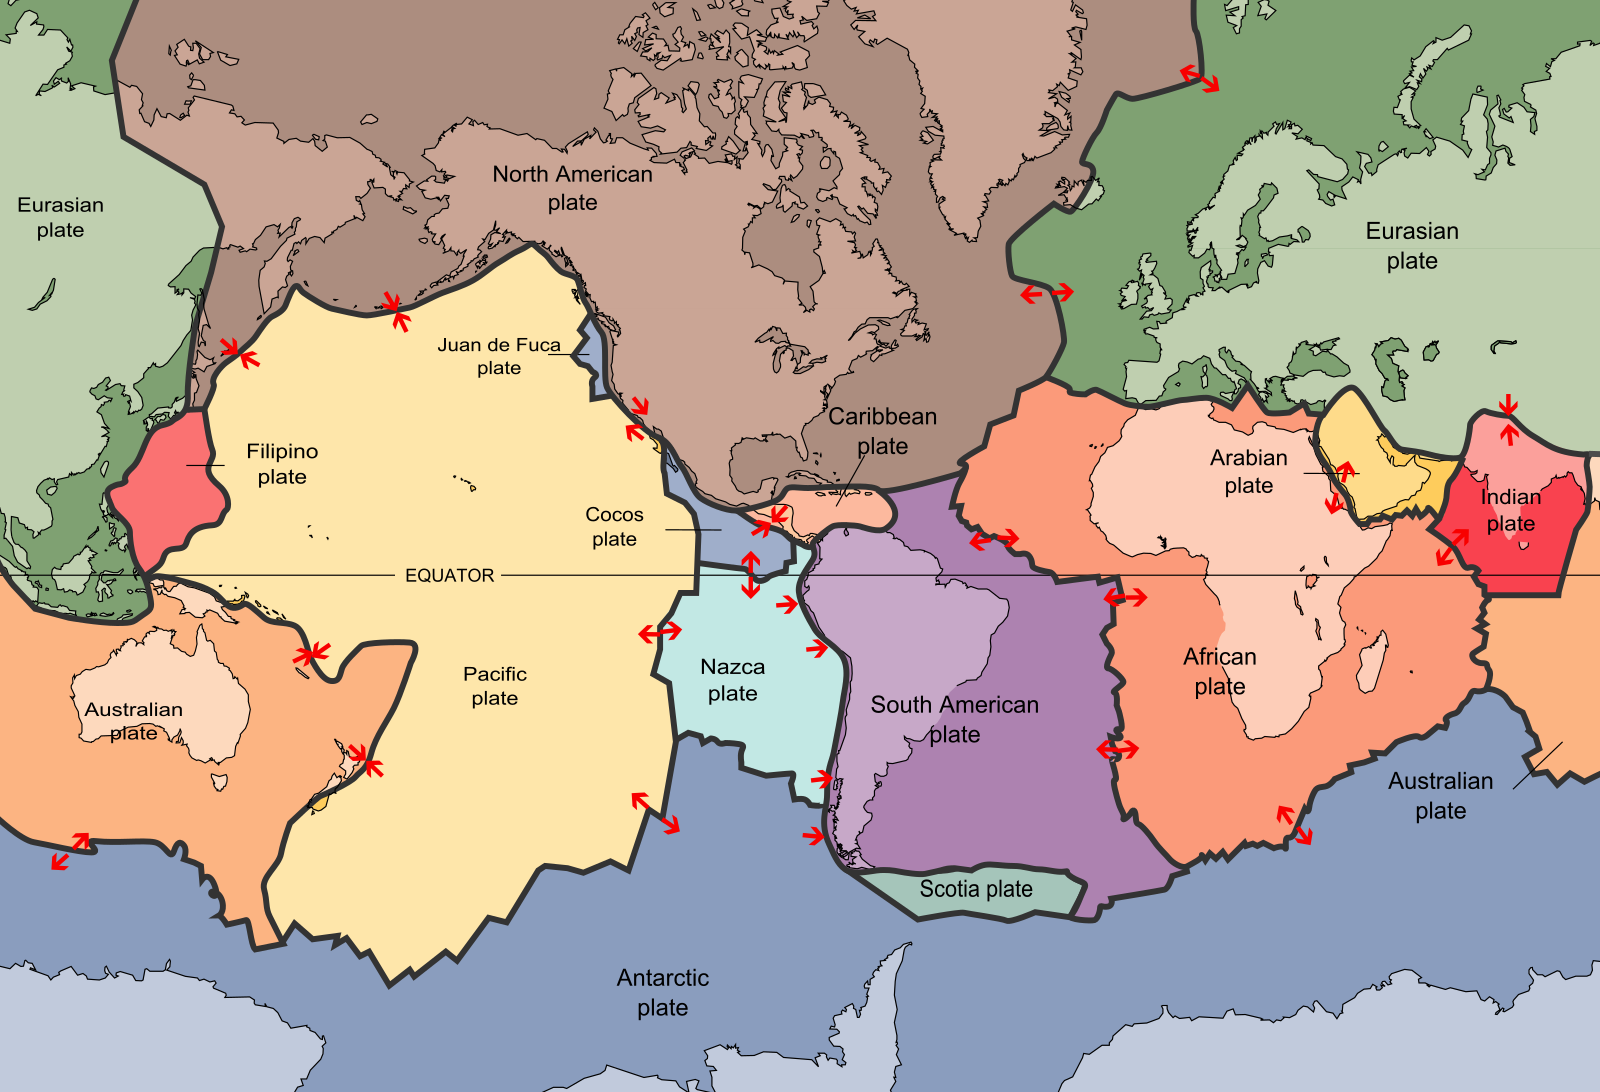
Not to be confused with the Earth’s crust layer, the lithosphere is composed of the crust AND a small amount of rigid upper mantle. On average, the lithosphere is 100 km thick.
The tectonic plates on Earth move over the something called the asthenosphere. The asthenosphere roughly makes up the remaining portion of the upper mantle down toward the transition zone. The temperatures within the asthenosphere are very hot and can exceed 1000-1300 ºC! Such high temperatures cause the rock of the asthenosphere to be nearly molten, and the solid rock will flow like silly putty. This movement of the asthenosphere alone, however, is not why the lithospheric plates on our surface move according to plate tectonics!
The beauty of plate tectonics is that it is a whole Earth theory. That means it considers the processes that occur within the Earth in addition to those on the Earth’s surface to explain our observations. One of these processes is something called convection. Convection occurs within the mantle when it is supplied with fresh heat from the core. The heat in the mantle rises toward the Earth’s surface, while the colder materials sink toward the bottom. This process creates convection cells, which when illustrated, appear as circular patterns of heat movement (see below image).
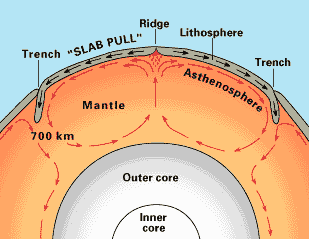
It is the movement of solid, hot material within the mantle that causes the rigid plates above it to move. Plates move at a rate of a few centimeters a year, about the same rate fingernails grow [13]. These movements come in the form of rifting, colliding, and shearing, which we will learn about in the next chapter.
***See 2.10 for Text and Media Attributions
A hypothesis that claims the Earth's landforms, specifically continents, move across the oceans over tens of millions of years.
three-dimensional rises and falls in elevation of the seafloor.
The world's longest mountain chain found beneath the Atlantic ocean between North America, South America and Europe and Africa. The Mid-Atlantic Ridge is an example of a mid-ocean ridge, or MOR.
Fe2+Fe3+2O4
A dark gray, oxide mineral that is iron-rich. Magnetite is strongly magnetic and attracts iron-rich materials.
A concept which describes how magnetic force is distributed around something, such as a planet.
A process of oceanic crust creation at mid-ocean ridges in which magma rises from the mantle, cools, and pushes existing rock at the ridge outward.
molten rock that can be found beneath the Earth's surface.
A hot interior layer of solid rock between the crust and core that is capable of plastic flow. The mantle is the largest layer of Earth.
The thin, outermost layer of Earth composed of rigid rock, which is home to all known life on the planet.
A type of rigid, thin crust made of iron and magnesium rich minerals that is found beneath the planet's oceans.
a narrow, deep depression in the seafloor that forms when a tectonic plate subducts at a convergent boundary. These features can extend as deep as 11 km deep.
The theory that the outer layer of the Earth (the lithosphere) is broken in several plates, and these plates move relative to one another, causing the major topographic features of Earth (e.g. mountains, oceans) and most earthquakes and volcanoes.
The outer, relatively rigid layer of the Earth that responds to the emplacement of a load by flexural bending.
The outermost layer of the Earth's mantle, which contains both the lower lithosphere and upper asthenosphere. This layer is susceptible to convection currents and plastic flow.
A ductile but solid, hot layer in the Earth composed of the lower crust and upper mantle that flows like putty over long periods of time. It drives the movement of the rigid tectonic plates riding above.
a region between the upper and lower mantle in which dense rocks may store water in quantities as large as the Earth's oceans.
movement driven by density and heat in which low-density hot materials move upward and dense, cold materials sink downward.

