
PowerPoint Practice 4

Prefer to watch and learn? Check out this video tutorial:
Complete the following Practice Activity and submit your completed project.


We will continue to work with the PowerPoint presentation from PowerPoint Practice 3. After submitting your presentation to the Director of Marketing, she has asked you to make a few enhancements that incorporate multimedia and statistical data. Key skills in this practice include screenshots, embedding videos, recording audio, background images, charting data with line and bar charts.
- Start PowerPoint, notice how it opens in Backstage View. Under Open, browse to locate your PowerPoint_Practice_3, and select open.
- Select File, Save As, Browse, and then navigate to your PowerPoint folder on your flash drive or other location where you save your files. Name the presentation as Yourlastname_Yourfirstname_PowerPoint_Practice_4.
- There should be 8 slides in your slide deck. Ensure your presentation is in normal view and select slide 8.
- Open a new browser window, and navigate to the PVCC Home Page. The URL is www.paradisevalley.edu.
- With slide 8 still active, go to the Insert tab, Images group, Screen Shot and select screen clipping. Take a screen clip of the top portion of the PVCC home page, and insert it into side 8. The screen clip should be under the Puma Commitment logo, and above the text box that contains the text: It is great to be a Puma!
- With the screen shot image still selected, resize it so that it has an approximate height of 1.75” and an approximate width of 7.5”. If necessary, move the Puma Commitment image up, and the text boxes down to create enough space for the screen shot image.
- Select the screen clip image you just added, and on the Animations tab, in the Animations group, add the Fade animation to the screen shot image. On slide 8, in the notes pane, add the following note after the note that is already there: Then, explain all of the resources available on the PVCC Home Page.
- Select slide 5. On the Home tab, in the Slide grouping, add a new slide with the Title and Content Layout. In the title placeholder type: PVCC Fine Arts.
- In the content placeholder below the title, click the icon to insert an online video. To insert an online video, you can also use the Insert tab, Media group, video, online video. It may take a few moments to the Insert Video screen to load.
- Use the Search YouTube box by typing in PVCCFineArts, and then selecting the search icon or pressing enter on your keyboard. Scroll through the videos to find the video titled Let it Be Summer 2020. If that video is not available, you can select a different one. Double click the video, or select Insert to add the video to slide 6.
- With the video selected, on the Video Tools, Format tab, resize the video so that it has a height of approximately 5” and a width of approximately 9.4”. Move the video so that it is center one the slide if necessary.
- On the Playback tab, select Play to watch the video.
- Another way to add an online video to a PowerPoint slide is by embedding it. Using your web browser, navigate to www.youtube.come. In the search window, type, Let it be summer 2020. Locate the PVCC Fine Arts video Let it be summer 2020. Select the Share icon, and then select embed. Copy the embed code.
- In PowerPoint, on slide 6, select the Insert tab, Media group, Video, Online Video. In the box next to From a Video Embed Code, paste the code you copied from YouTube and then press enter. It may take a few moments for the video to preview. If necessary, right click on the video, and then select Preview.
- Select slide 9 so that it is the active slide. On the Insert tab, Media group, select the arrow under Audio and select Record Audio. Record a short audio clip (about 20 seconds) and tell me why PVCC is your college of choice.
- After recording your audio and playing it back, name it PVCC. Then, close the Record Sound audio dialog box. Notice a speaker icon displays on slide 9. Move this icon to the upper left hand corner of slide 9. Click the speaker once to play the audio.
- On slide 9, in the Notes pane, add the following note: Remember to play the audio.
- Select slide 1 so that it is the active slide. On the Design tab, customize group, select Format Background. Under Fill, select the button next to Picture of texture fill. Under insert picture from file, select the File button and browse to where your data files are stored. Locate the image PowerPoint_Practice4_Step18 and select Insert. Be sure to not select Apply to All, as we only want the background image applied to the title slide.
- Close the Format Background dialog box by clicking the x in the upper right hand corner.
- On slide 1, delete the text box that says Fall New Student Orientation. If necessary. Move the textbox that says Welcome Pumas up slightly, and change the font color to a font that is easier to see with the new background image.
- Select slide 6 so that it is the active slide. Select and delete the Explosion image on slide 4. In that spot, we are going to add a clustered column chart that displays the Average GPA for each athletic team.
- On the Insert tab, in the Illustrations group, select Chart. In the Insert chart dialog box, select column, and then clustered column, then select ok.
- A dialog box should appear to Chart in Microsoft PowerPoint. It looks like a mini Excel spreadsheet. Enter the following data:
|
|
Soccer |
Golf |
Tennis |
CC |
T&F |
Baseball |
Softball |
|
Average GPA |
4 |
3.5 |
3.8 |
3.75 |
3.6 |
3.75 |
4 |
- Notice how the clustered column chart updates the data automatically as you type in the data. Close the Chart in Microsoft PowerPoint dialog box when all of the data has been entered.
- With the clustered column chart selected, on the Chart Tools Design tab, select the arrow net to Add Chart Element. Next to Legend, select Right to move the Legend from the bottom of the chart to the Right side. If necessary, resize the legend so that all of the sports are visible.
- Change the chart title to Average GPA by Team.
- Select the vertical Axis, right click and select Format Axis. In the format Axis dialog box, set the Axis Options, Bounds to 3.0 for the minimum and 4.0 for the Maximum. Close the Format Axis dialog box.
- With the clustered column chart selected, on the Chart Tools Design tab, in the Chart Styles group, select the Quick Style Style8.
- Use the Smart guides to resize and move the clustered column chart so that it fits neatly to the right of the bulleted list on slide 4.
- Select slide 5 so that it is the active slide. Select and delete the Health Sciences logo on slide 5.
- On the Insert tab, select Line, and then insert a Line with Markers chart. Select OK to close the Insert Chart dialog box.
- In the Chart with Microsoft PowerPoint dialog box, enter the following data:
|
|
Health Sciences |
STEM |
CIT |
Education |
|
2018 |
500 |
300 |
550 |
200 |
|
2019 |
600 |
350 |
580 |
210 |
|
2020 |
700 |
400 |
600 |
300 |
|
2021 |
800 |
450 |
610 |
350 |
- After the data is entered, close the Chart in Microsoft PowerPoint dialog box. Resize and move the chart to that it fits in the lower right hand corner of slide 5.
- With the line chart selected, on the Chart Tools Design tab in the Chart Layout options group remove the chart title and ensure the legend is in the Top position.
- With the line chart selected, on the Chart Tools Design tab, in the Chart Styles group, select Style 9 Quick Style.
- Double click the vertical axis to open the Format Axis dialog box. Under Axis Options, Bounds, enter 200 for the minimum and 800 for the maximum. Close the Format Axis Dialog Box.
- On slide 5, in the notes pane, add the following speaker note: This line graph displays our fastest growing 4 fields of interest over the past 4 years.
- Select slide 2 so that it is the active slide. Select the image. On the Picture Tools, Format tab, in the Adjust group, select remove background. Select the area that you would like to keep, then select keep changes.
- Change the view of your presentation to Slide Show. Use the arrows to advance each slide.
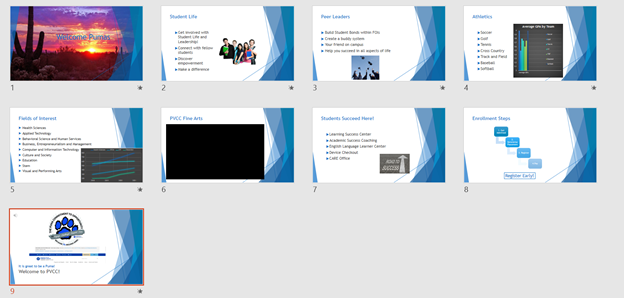
- Save your presentation, and take note of where it is located. There should be a total of 9 slides in your slide deck. Compare your presentation to the image below, and make any modifications if needed. Close out of PowerPoint and submit your entire presentation per your instructor’s instructions.
Media Attributions
- Practice It Icon © Jessica Parsons is licensed under a CC BY (Attribution) license
- Chapter3_Challenge_unsplash_thisisengineering-raeng-6DSItOWspGY- © ThisisEngineering RAEng is licensed under a CC0 (Creative Commons Zero) license
The main page of a website
Stands for Uniform Resource Locator, also common only know as a web address
A picture of one’s computer screen that can be inserted into a presentation
Allows you to capture an image from your screen
The integration of links, images, videos, gifs and other content from a variety of digital sources into a presentation
Sound files that can be recorded and embedded into a presentation
An image that can be added to the background of a PowerPoint slide and will be automatically resized to fill the entire slide
A type of chart that displays more than one data series in clustered vertical columns; commonly used for direct comparison of multiple series, but they become visually complex quickly
Automatically removes unwanted portions of a picture, makers can be used to indicate areas to keep or remove from the picture
