
10.5 Fossil Fuel Issues
Jeff Simpson
Learning Objectives – By the end of this chapter, you should be able to do the following.
- Describe the environmental, social and economic impacts of fossil fuel extraction and use.
In the previous sections, we looked at each type of fossil fuel. In this section, we will look in greater detail at issues surrounding our use of fossil fuels in general.
Fossil Fuels Are a Nonrenewable – A Limited Resource
Fossil fuels are a limited resource. When we have alternatives, should we stop burning molecules on which we depend to make so many things – plastics, pharmaceuticals, chemicals, roads, make-up, etc. The alternatives to burning fossil fuels are less carbon-intensive, do not require as much extraction, do not treat our atmosphere as a dumping ground, and do not come with the massive negative health consequences of burning fossil fuels.
A common question is, “When will we run out of fossil fuels?” We won’t. But, as we extract the easy-to-get deposits, continued extraction will become so difficult and expensive that it won’t make financial sense. For example, in the 1800s, to get 100 units of oil energy out of the ground took one unit of energy. By 2010, to get 100 units out of the ground required 51 units of energy. We are spending more, getting less, and causing more pollution.
As of 2020, there were an estimated 1.73 trillion barrels of proven oil reserves in the world. We are using ~97,000,000 barrels of oil/day. (This figure is higher than in the video below.) At this rate, we have ~49 years of oil remaining at today’s levels of consumption. Should we be burning through this so quickly?
Take notes as you watch the video below.
In the 1970s, the fossil fuel companies estimated that the world had a 600 year supply of coal.
In less than 50 years, that “600-year” supply has shrunk rapidly.
Video 10.5.1 – Will Fossil Fuels Run Out? (5:22)
Fossil Fuels Are the Primary Driver of Climate Change
Fossil fuels are made mainly of hydrogen and carbon. When burned, the carbon combines with oxygen to create carbon dioxide (CO2). The amount of CO2 produced depends on the carbon content of the fuel. For each unit of energy from coal, natural gas produces about 50% less CO2 and petroleum produces about 25% less. The burning of fossil fuels in all forms – coal, oil, and methane – accounts for about 80% of total U.S. human-caused (anthropogenic) greenhouse gas (GHG) emissions. There are many sources of non-energy CO2 emissions, but those emissions account for a relatively small share of total GHG emissions [6].
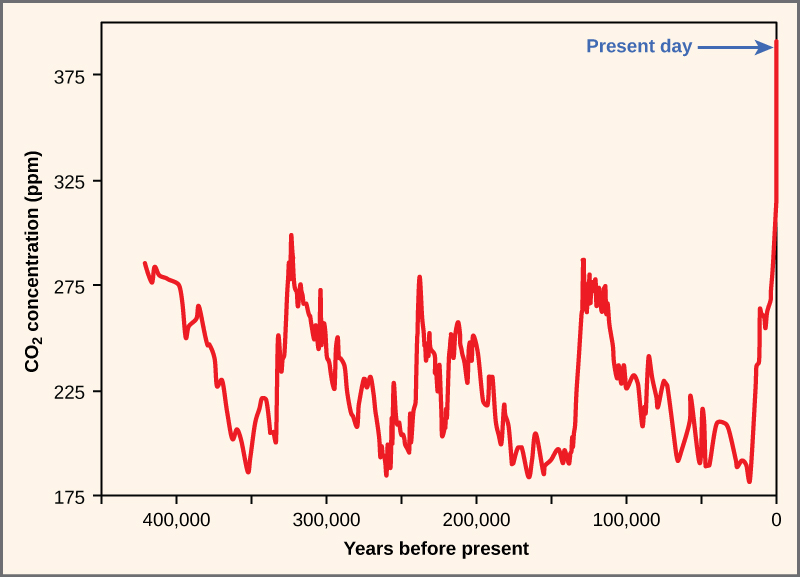
For the last 600,000 years, atmospheric levels of CO2 have varied between 180 and 280 PPM (parts per million). Since the industrial revolution, that level has risen to over 415 PPM and is rising at a faster and faster rate.
Burning fossil fuels releases greenhouse gasses. With more greenhouse gasses trapping heat, average annual global temperatures are rising. Warming temperatures are bringing changes to much of the planet including Arizona. Precipitation is decreasing, temperatures are rising, the snowpack has decreased, forests are burning, and the environment of the state is responding to these changes. Globally, glaciers are retreating, sea level is rising, biomes are moving toward the poles, and we are seeing more extreme weather events. We will study climate change in more detail in another chapter.
There are solutions as shown in the two videos below. (Fossil fuel companies will not like this but anybody who likes clean air and healthy lungs will.) The gist of this is that we must leave fossil fuels in the ground or at least stop burning them though continuing to make things with them.
Video 10.5.2 – Climate Change & Energy 101 (4:19)
Video 10.5.3 – How America Can Leave Fossil Fuels Behind, in One Chart (~8:40)
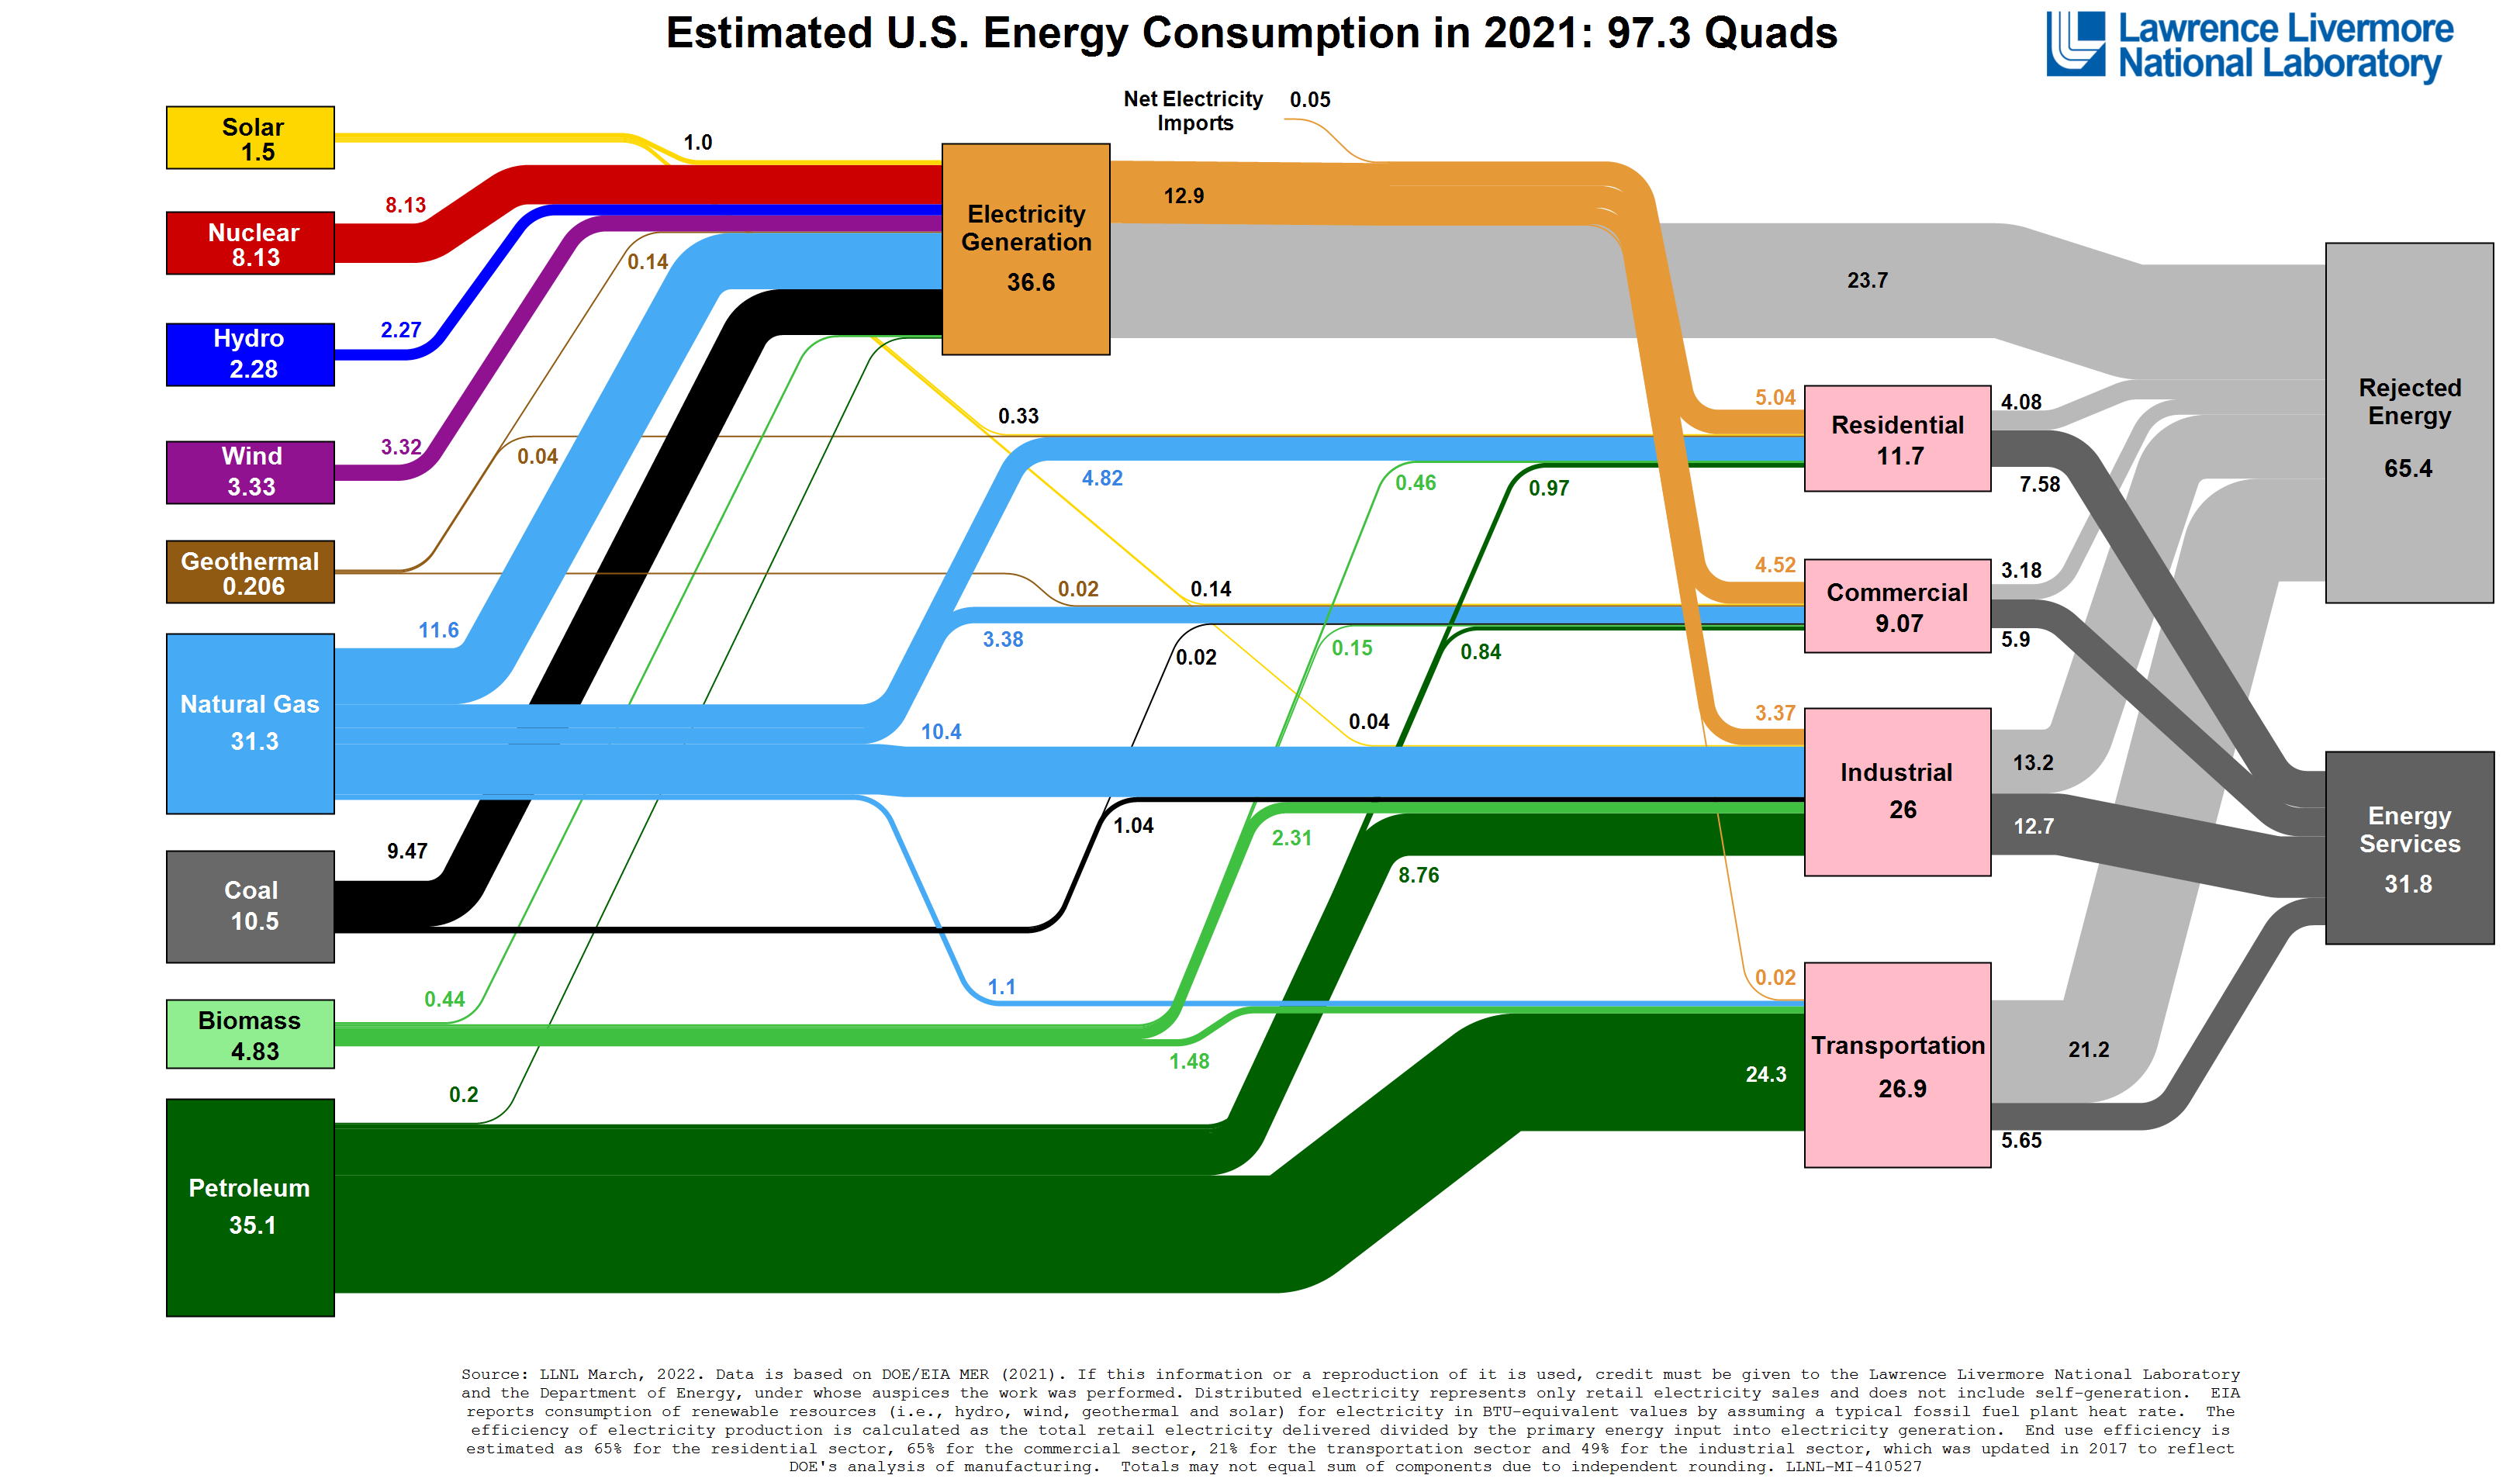
The above two videos and the Sankey diagram are the basis for our next quiz. As Saul Griffith’s Sankey diagram is interactive, please open it in a new tab and look around. A more simple version is below and may be easier to understand.

Political Ramifications
This section can be brief: Nations go to war over energy. The rationale may be “in our national interest” but that “national interest” has often centered around oil. If governments wean themselves from fossil fuels by transitioning to nuclear and geothermal, their economies would be stronger, their people would be healthier, their water, soil, and air would be cleaner, and their nations more secure. We saw the ramifications of our dependence on fossil fuels in the war in Ukraine as shown in the clickable graphic below.
https://www.visualcapitalist.com/visualizing-the-eus-energy-dependency/

Fig 10.5.3 – Visualizing the EU’s Energy Dependency. (Source)
Ocean Acidification
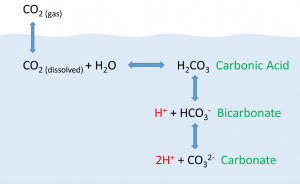
The ocean historically has absorbed roughly half of all the CO2 added to the atmosphere. The gaseous CO2 dissolves in the water and creates a bicarbonate ion (HCO3). The reaction releases a hydrogen atom which acts as an acid, and lowers the pH of water, making the oceans more acidic. (Fig. 10.5.2)
As anthropogenic sources of atmospheric CO2 have increased since the Industrial Revolution, the oceans have been absorbing an increasing amount of CO2, and researchers have documented a decline in ocean pH from about 8.2 to 8.1 in the last century. This may not appear to be much of a change, but pH is recorded on a logarithmic scale. This decline represents a 30% increase in acidity. Even at a pH of 8.1, the ocean is not what we would call acidic, just more acidic. [7]
Why is this important? Declining pH impacts many biological systems. Of particular concern are organisms that secrete calcium carbonate shells or skeletons, such as corals, shellfish, and many planktonic organisms. At lower pH levels, calcium carbonate dissolves, eroding the shells and skeletons of these organisms [7]. Another consequence is the reduction of free carbonate ions in the water. Since these are key building blocks for organisms, its availability limits the organisms capacity to grow. These organisms form the base of the food chain. Their demise affects all life in the ocean.
The ability of oceans to absorb the CO2 we have spewing into the air is diminishing. This means that more of the CO2 will remain in the atmosphere and lead to greater climate change.

Video 10.5.4 – How Does Ocean Acidification Affect Coral Reefs? (1:26)
Oil Spills and Leaks
Human-caused oil spills in rivers and oceans harm ecosystems. Natural oil seepages do occur and may be a significant source of oil that enters the environment globally, but they are slow, small, spread out over large areas, and the ecosystem has adapted to them. Spills from tankers or well spills have more catastrophic impacts. The quantity of oil spilled during accidents has ranged from a few hundred tons to several hundred million tons, but even small spills have a great impact on ecosystems.[6] (See this site for an interactive timeline of oil spills.)
Oil spills at sea are generally more damaging than those on land as they can spread for hundreds of nautical miles in a thin oil slick which can cover beaches with a thin coating of oil. This can kill seabirds, mammals, shellfish and other organisms it coats. The Deepwater Horizon spill in the Gulf of Mexico in 2010 spilled 4.9 million barrels of oil.
Oil spills on land are more readily containable if a makeshift earth dam can be rapidly bulldozed around the spill site before most of the oil escapes, and land animals can avoid the oil more easily. The amount of oil spilled from ships dropped significantly during the 1990s partly because new ships were required to have a double-hull lining to protect against spills [6].
Leaks also happen when we use petroleum products on land. Gasoline drips onto the ground when people are filling gas tanks. Motor oil sometimes is thrown away rather than being recycled after an oil change. Fuel tanks at gas stations have contaminated groundwater, though all buried tanks in the US are supposed to be replaced by tanks with a double lining and monitors. [6] After a rain, oil that vehicles drip onto roads and parking lots runs into rivers, groundwater and the ocean. Fuel and oil often leak from motor boats and jet skis. When a leak in a storage tank or pipeline occurs, petroleum products can also get into the ground, and the ground must be cleaned up.
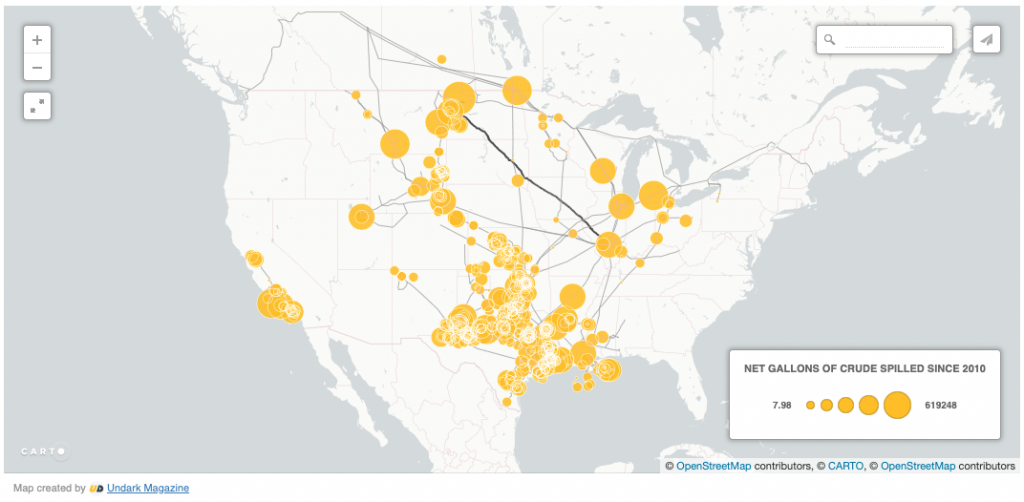
The US has a history of extensive oil and gas leaks.
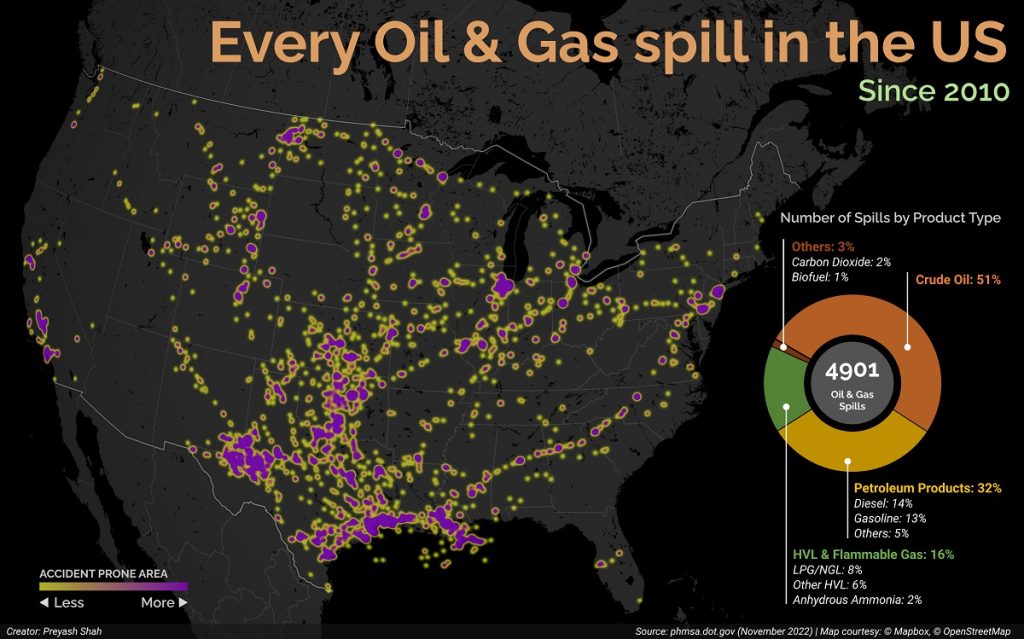
Fig.10-5-6 – Mapped: Oil and Gas Spills in the U.S. Since 2010 (Source)
Video 10.5.5 – The deepwater Horizon spill, April 10, 2010, was the largest marine oil spill in history. Prof. Donald Boesch explains why offshore drilling is not safer a decade later.
We often see news of a pipeline protest in which people will say, “Gas prices are high because they blocked the pipeline.” There is a problem with this claim. There is not “the” pipeline. The US is a network of tens of thousands of miles of both oil and gas pipelines. Blocking one pipeline may be a setback for the company trying to build the pipeline across the property of others, but there are plenty of other pipelines.
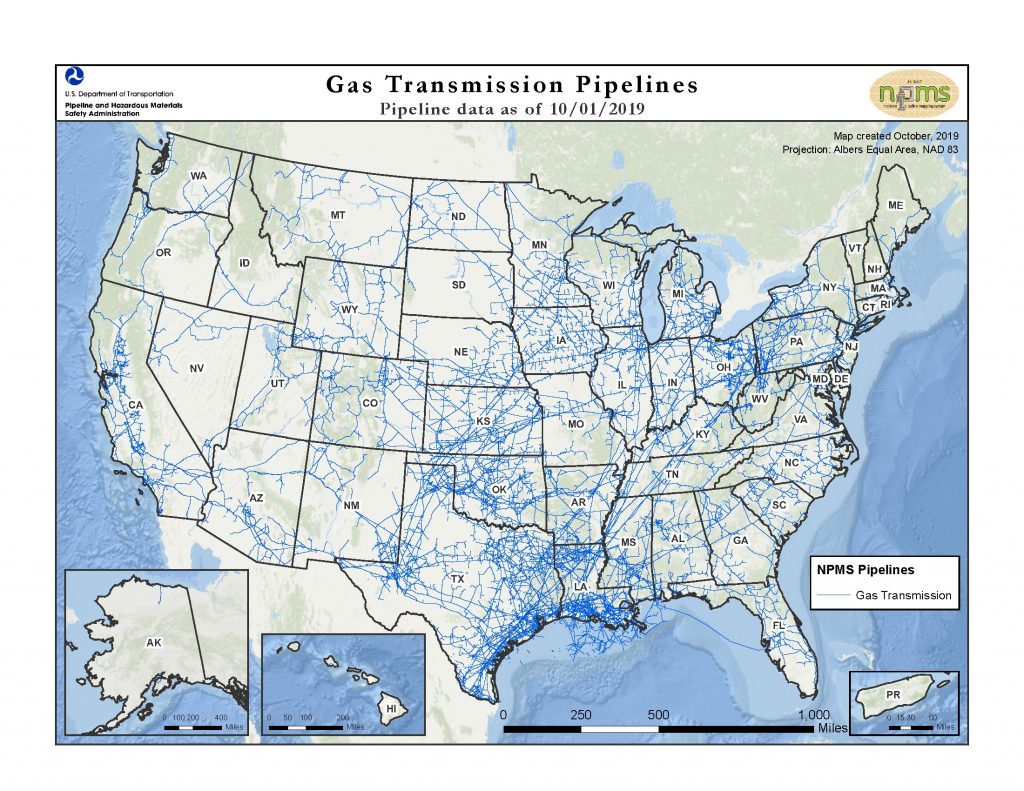
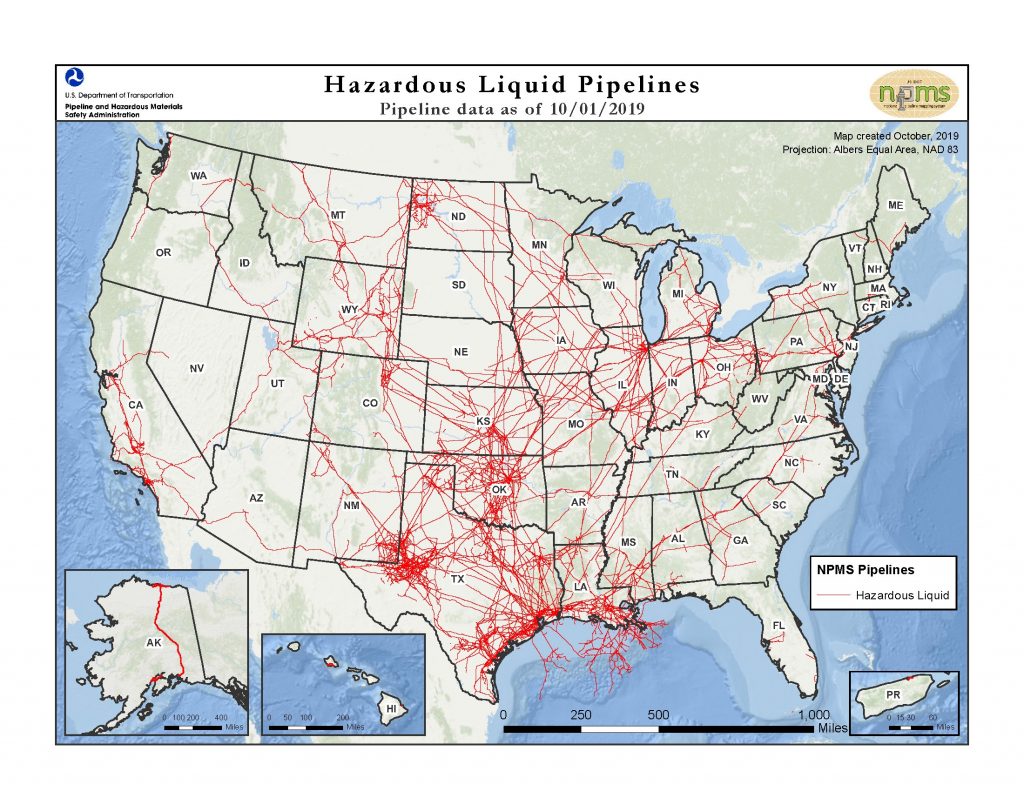
All pipelines leak. The interactive map below is a record of reported leaks in the US, showing that we average one leak every other day.
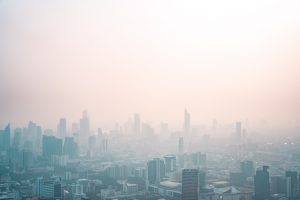
Air Pollution
Peer-reviewed research published in Nature showed that emissions from burning fossil fuels killed over 1,000,000 people around the world in 2017 with half of those deaths attributable to emissions from coal. [LINK] When burned, all fossil fuels release carbon dioxide (CO2), carbon monoxide (CO), sulfur dioxide (SO2), nitrogen oxides (NOx), and particulate material.
Though methane burns more cleanly than coal or oil, as a greenhouse gas, it is 25X more powerful than CO2. Methane leaks from pipelines and wells as well as coal mines. These fugitive emissions often are not monitored. TIn 2016, fugitive emissions accounted for 5.8% of all global greenhouse gas emissions.[L]
All of these are air pollutants that impact the environment and human health as well as the health of all organisms. (See more on air pollution in Chapter 6.)
Fossil fuels are burned in internal combustion engine vehicles and power plants and power much of our manufacturing. Fossil fuels are impure and do not burn completely. These incomplete chemical reactions produce pollutants including carbon monoxide (CO), nitrogen dioxide (NO2), sulfur dioxide (SO2), and hydrocarbons. Research has shown in 2020 that the pollution from diesel trucks alone will claim more than 400 lives in Illinois and make thousands of residents sick next year. [LINK]. Peer-reviewed research published in Nature showed that emissions from fossil fuels killed over 1,000,000 people around the world in 2017 with half of those deaths attributable to emissions from coal. [LINK]
- Carbon oxides include carbon monoxide (CO) and carbon dioxide (CO2). Both are colorless, odorless gasses. CO is toxic to both plants and animals. CO and CO2 are both greenhouse gases.
- Nitrogen oxides (NOX) are produced when nitrogen and oxygen from the atmosphere react at high temperatures. This occurs in hot exhaust gas from vehicles, power plants, or factories. Nitrogen oxide (NO) and nitrogen dioxide (NO2) are greenhouse gasses. Nitrogen oxides contribute to acid rain.
- Sulfur oxides include sulfur dioxide (SO2) and sulfur trioxide (SO3). These form when sulfur from burning coal reaches the air and reacts with oxygen. Sulfur oxides are components of acid rain.
- Impurities and additives are released upon fossil fuel burning. For example, lead (Pb) was once widely used in automobile fuels, paint, and pipes. This heavy metal causes brain damage or blood poisoning. Fortunately, lead is no longer added to gasoline. Mercury is another impurity commonly found in coal. Similar to lead, its neurotoxicity and genetic damage can harm humans for generations. Mercury is emitted as a gas, but it becomes a droplet as it cools, eventually falling to the ground. If they fall into sediments, bacteria convert them to the most dangerous form of mercury: methyl mercury. This is a highly toxic form of mercury.
- Volatile organic compounds (VOCs) are mostly hydrocarbons. Important VOCs include methane (a naturally occurring greenhouse gas that is increasing because of human activities), chlorofluorocarbons (human-made compounds that are being phased out because of their effect on the ozone layer), and dioxin (a byproduct of chemical production that serves no useful purpose but is harmful to humans and other organisms).
- Particulates are solid particles having small diameter sizes measured in micrometers or microns (µm). An indicator of air quality is the PM index. You may have seen or heard about PM10 or PM2.5. PM stands for particle matter and the number in the subscript indicates the particle size in microns. Particles measuring between 10-2.5 µm are considered “coarse” while particles with diameters less than 2.5 are considered “fine”. Notice that we are not talking about composition, rather we are differentiating particles based on their size. This useful distinction allows us to predict their behavior in the environment and their impacts on organisms. Examples of particulate matter include ash, dust, and even fecal matter. They are commonly formed from the combustion of fossil fuels and can produce smog. Particulates can contribute to asthma, heart disease, and some types of cancers.To learn more visit the EPA ‘What is PM?’ site
A type of air pollution produced by the chemical reaction between some molecules in auto-exhaust or oil refinery emissions, and sunshine is photochemical smog. This smog consists of more than 100 compounds, most importantly ozone. Ozone is damaging to the lungs and has other health effects.
Air pollution could have been problematic when ancient people burned wood for heat and cooking fires in enclosed spaces such as caves and small tents or houses, but the problem became widespread when the steam engine was invented and coal was burned during the Industrial Revolution. An air pollution crisis exploded in the developed nations in the mid-20th century. Coal smoke and auto exhaust combined to create toxic smog. In Donora, Pennsylvania, in October 1948, 20 people died and 4,000 became ill when coal smoke was trapped by an inversion. In London in December 1952, the “Big Smog” killed 4,000 people over five days. Many thousands more likely died of health complications from the event in the next several months.
Air pollution is not limited to the burning of fossil fuels. Simply extracting coal, oil and natural gas results in harmful releases to the atmosphere. This has effects on the health of those living nearby.
In 2015, the Aliso Canyon gas leak occurred. It was a massive natural gas leak from a well within the Aliso Canyon underground storage facility. This second-largest gas storage facility of its kind in the United States belongs to the Southern California Gas Company . An estimated 97,100 tonnes of methane and 7,300 tonnes of ethane were released into the atmosphere. The initial effect of the release increased the estimated 5.3 Gt of methane in the Earth’s atmosphere by about 0.002%, diminishing to half that in 6–8 years. It is believed to be the worst single natural gas leak in U.S. history in terms of its environmental impact. (By comparison, the entire rest of the South Coast Air Basin combined, with a population of about 18 million people, emits approximately 413,000 tonnes of methane and 23,000 tonnes of ethane annually.) The Aliso gas leak’s carbon footprint could be larger than the Deepwater Horizon leak in the Gulf of Mexico. [LINK]
The terrible events in Pennsylvania and London, plus the recognition of the hazards of photochemical smog led to the passage of the Clean Air Act in 1970 in the United States. The act now regulates 189 pollutants. The six most important regulated pollutants are ozone, particulate matter, sulfur dioxide, nitrogen dioxide, carbon monoxide, and the heavy metal lead. Other important regulated pollutants include benzene, perchloroethylene, methylene chloride, dioxin, asbestos, toluene, and the metals cadmium, mercury, chromium, and lead compounds.
What is the result of the Clean Air Act? In short, the air in the United States is much cleaner. Visibility is better and people are no longer incapacitated by industrial smog. However, despite the Act, industry, power plants, and vehicles put 160 million tons of pollutants into the air each year. Some of this smog is invisible and some contribute to the orange or blue haze that affects many cities.
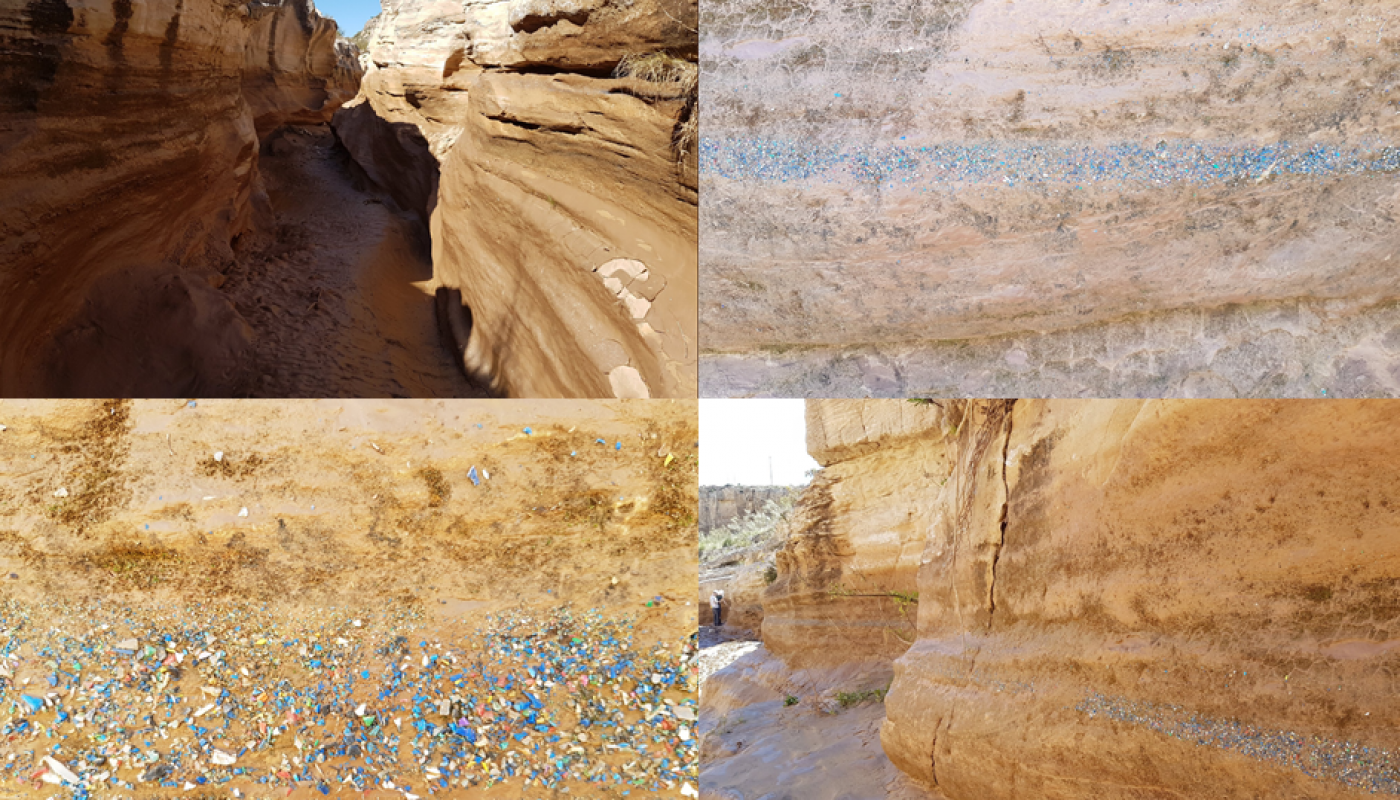
Plastic Waste
Though the oil is used primarily for transportation (light vehicles, trucks, airplanes, and ships), oil also is used to manufacture plastics and other synthetic compounds ubiquitous to our everyday life [6]. Unfortunately, the same property that makes plastics useful – their longevity – is the property that allows them to persist in the environment. Unlike wood, paper, or metals, there are no natural decay processes for plastics, and plastics are accumulating all around our planet, reaching the deepest parts of the ocean and inside our bodies. Plastic can be broken into smaller, invisible pieces, but those pieces still are plastic. Plastic does not degrade rapidly. Plastic is even beginning to show up in sedimentary rock layers. One of the ways that geologists establish a new geologic era or period is by a change in the sedimentary rocks. Some geologists are calling any time after this layer of plastic the anthropocene.
Backyard Geology: Coal in Navajo Nation
The Navajo Generating Station (NGS) opened in 1974 to power the Southwest and to send south water from the Colorado River (toward Phoenix and Tucson). The 2,250 Megawatts of electricity powered big cities, like Los Angeles, Phoenix, and Las Vegas.
The Kayenta coal Mine, in Black Mesa, AZ supplied the coal to power the Navajo Generating Station (NGS); Peabody Energy, a multinational company, operated it. The Black Mesa mine also supplied coal to the Mohave Generating Station, in Nevada. They moved the coal in the form of a slurry, using nearly 3.3 million gallons of water pumped from the Navajo Aquifer. The mining operation dried springs on which the Navajo had relied since the 1400s when they came to this area.
To cool the plant and to control dust pollution, the NGS used 32,000 acre-feet of Colorado River water per year. This same amount of water would supply ~64,000 homes. Water is scarce in the desert, and the Navajo aquifer was the only source of drinking water for the population. Now the Navajo must haul water for their livestock, and for them. Yet, some Diné (Navajo) could find jobs at home and built their lives around the mining activity. This was an incentive and an advantage for them.
.jpg)
Then the coal industry lost its ground due to air pollution concerns and the availability of new unconventional resources that made their price decline. The price of gas coal dipped, they were no longer profitable. Since 2010, more than half of coal-fired electricity plants have closed or will soon be closed. Coal is not coming back.
In 2017, the NGS plant’s operator (SRP) announced that they would shut off the plant by December 2019. This would mean closing the Kayenta mine as well. The announcement stirred the Navajo Nation. At least 700 Native people worked on the coal plant and coal mine, and over 2000 had jobs linked to the coal industry. For many of them, the closing meant losing their way of living. Further, the cuts in the revenue received by the Navajo government would leave a big fiscal hole for the Tribal Nation. The Navajo economy had become dependent on coal, so some tribal members tried to stop the closing.
But not everyone agreed. Opponents to the mine received the news well. The coal mine scarred the landscape, desecrated Black Mesa, polluted the air, left them without water, and caused an increased rate of diseases such as cancer, heart failure, and asthma; the Clean Air Act linked the disease to the coal operations. What’s most, the Navajo were direct beneficiaries of the energy their resources and land generated. Despite owning a generation plant, one-third of their homes lack power and water access.
In 2020 the NGS plant was demolished, marking the decline of coal in the west. But they left the Navajo Nation to pay for all the environmental impacts. Peabody has requested the Office of Surface Mining to delay much of the reclamation work, until 2022. The company could have maintained jobs by employing them to return the open coal pits to workable land. But they didn’t. Instead, they asked for an extension. Do you think Peabody behaved in an ethical way?
When raw goods on reservation lands are purchased by powerful actors from underserved communities under unfavorable conditions at a fraction of their eventual wealth, this is called resource colonialism (Curley, 2017). And unfortunately, the NGS and the coal mines associated with it are an example of this type of costly extraction.
Listen to Anita Yazzie as she recalls the water, plant and environmental services that were lost due to the coal operation.
resulting from human activities
Interventions to make the landscape useful again
