
8.5 Sea Level Change
Sea-level change has been a feature on Earth for billions of years, and it has important implications for coastal processes and both erosional and depositional features. Figure 8.5.1 shows the variation in sea level height in millimeters since 1993. How would you describe the trend?

Why does the sea level rise? What are three important mechanisms that produce the change? Video 8.4.1. explains it in simple terms
Video 8.5.1. Oceanographer Josh Willis from NASA’s Jet Propulsion Laboratory narrates this video about the causes of sea level rise and how sea level has changed over the last two decades, as observed by the Jason series of satellite missions (1:58).
Eustatic sea level change
Eustatic sea-level changes are global sea level changes. Here, the sea level increases or decreases due to changes in the volume of glacial ice, that is, more glacial ice on land means less liquid water in the oceans; or less glacial ice on land means more water in the oceans and higher sea levels. The sea level can also change when the shape of the seafloor changes, driven by plate tectonic processes. For example, if the rate of seafloor spreading changes at mid-ocean ridges, the seafloor’s shape near the ridges will change, they can become wider or higher, which affects sea level because the volume of water is being displaced.
Over the past 20,000 years, there have been approximately 125 meters (410 feet) of eustatic sea-level rise due to glacial melting. Most of that took place between 15,000 and 7,500 years ago during the significant melting phase of the North American and Eurasian Ice Sheets. At around 7,500 years ago, the rate of glacial melting and sea-level rise decreased dramatically, and since that time, the average rate has been in the order of 0.7 mm/year. Anthropogenic climate change has accelerated sea-level rise starting around 1870. Since that time, the average rate has been 1.1 mm/year, and it has been escalating. Since 1992, the average rate has been 3.3 mm/year! (4) It may not sound as much, but the population is affected by the millions.
Video 8.5.2. As human activity warms our planet, the ocean absorbs over 90 percent of the excess heat. This increases water volume and melts ice sheets and glaciers, contributing to sea level rise. Watch the video to learn how much global sea level is rising each year, what that looks like in everyday terms, and why it matters. Source: NASA (1:54)
Isostatic sea level change
Isostatic sea-level changes are local sea level changes. When the crust goes up (uplift) or goes down (subsides) the sea level changes. The crust goes up on down due to changes in its loading, following the principle of isostacy. For example, when mountains grow the crust piles in reverse faults and folds. As a result of the overload, the crust will sink. These changes can alter the coastline and the sea level locally. Another example is when glacial caps melt. The crust can “bounce back up” since it lost load. Almost all of Canada and parts of the northern United States were covered in thick ice sheets at the peak of the last glaciation. Following the melting of this ice, there has been an isostatic rebound of continental crust in many areas. This ranges from several hundred meters of rebound in the central part of the Laurentide Ice Sheet (around Hudson Bay) to 100 m to 200 m in the peripheral parts of the Laurentide and Cordilleran Ice Sheets – in places such as Vancouver Island and the mainland coast of BC. Although the global sea level was about 130 m lower during the last glaciation, the glaciated regions were depressed at least that much in most places, and more than that in places where the ice was thickest. (7)
Emergent and submergent coasts
Coastlines where the sea level is falling are called emergent. There are many features associated with emergent coasts. The shorelines can be rocky, with sea cliffs.
Where the shoreline is rocky, waves refracting around headlands attack the rocks behind the point of the headland. They may cut out the rock at the base, forming a sea arch that may collapse to isolate the point as a stack, (Fig. 8.4.5). Rocks behind the stack may be eroded, and sand eroded from the point collects behind it, forming a tombolo, a sand strip that connects the stack to the shoreline. Where sand supply is low, wave energy may erode a wave-cut platform across the surf zone, exposed as bare rock with tidal pools at low tide. Sea cliffs tend to be persistent features as the waves cut away at their base, and higher rocks calve off by mass wasting. If the coast is emergent, these erosional features may be elevated compared to the wave zone. Wave-cut platforms become marine terraces, with remnant sea cliffs inland from them. (4)
Coastlines where the sea level is rising are called submergent. Features associated with submergence coasts include estuaries, bays, and river mouths flooded by the higher water. Fjords are ancient glacial valleys now flooded by post-Ice Age sea level rise. Barrier islands form parallel to the shoreline from the old beach sands, often isolated from the mainland by lagoons behind them. Some scientists hypothesize that barrier islands formed by rising sea levels as the ice sheets melted after the last ice age. Accumulation of spits and far offshore bar formations are also mentioned as formation hypotheses for barrier islands.
Estuaries and fjords commonly characterize coastlines in areas where there has been a net sea-level rise in the geologically recent past. This valley was filled with ice during the last glaciation, and there has been a net rise in sea level here since that time. Uplifted wave-cut platforms or stream valleys characterize coastlines in areas where there has been a net sea-level drop in the geologically recent past. Uplifted beach lines are another product of relative sea-level drop, although these are difficult to recognize in areas with vigorous vegetation.
Video 8.5.3. How do science use modeling to make better decision for the city of Norfolk, VA? (2:34)
Backyard Geology: Sea-level changes recorded in rocks
While it seems fairly obvious that there are no real coastlines in Arizona, the rocks throughout the state attest to their existence in the past. In fact, Arizona had coastlines multiple times.
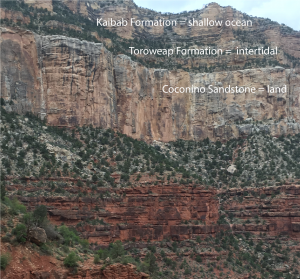
Figure 8.5.2 shows the three uppermost layers of the Grand Canyon, the Coconino Sandston, the Toroweap Formation and the Kaibab Formation. Though these layers were deposited millions of years ago, they encode the environments present at their time of deposition. The older Coconino Sandstone is a 275 million-year-old wind-blown sand which forms a dramatic cliff in the present day. This sandstone was deposited as sand dunes on firm land. The Toroweap Formation was formed in an intertidal zone, as sea-level was rising and falling but ultimately inundating the arid lands. The youngest Kaibab Formation, 270 million-year-old, is a limestone that was deposited in a shallow marine (ocean) environment. Together, these rock show that sea-level came into the continent, or transgressed, in just 5 million years, and much of Arizona was entirely under water!
Key Takeaways
- Sea level changes over time have expanded and contracted continental shelves, created and destroyed inland seas, and shaped the surface of land.
- We are experiencing an eustatic (global) sea level change. Scientists observe and collect data using satellites to understand hazards and challenges related to sea level change.
Crustal loading, as by ice, water, sediments, or volcanic flows, leads to isostatic depression; removal of load, to isostatic uplift.
a large stone tower, separated from the main shoreline
Area of water between the high tide level on the beach and the seaward side of the breaking waves.
gently sloping rock ledge that extends from the high-tide level at the steep-cliff base to below the low-tide level
a long, narrow, deep inlet of the sea between high cliffs, as in Norway and Iceland, typically formed by submergence of a glaciated valley
elongated bodies of sand forming parallel to the shoreline from longshore currents
the tidal mouth of a large river, where the tide meets a stream
An organic or chemical sedimentary rock that is primarily composed of calcium carbonate (CaCO3). Limestone is a subgroup of rocks that includes chalk, coquina, and fossiliferous limestone.
