
10.11 Wind Power
Jeff Simpson and Carolina Londono Michel
Learning Objectives – By the end of this chapter, you should be able to do the following.
- Explain how a wind turbine produces electricity.
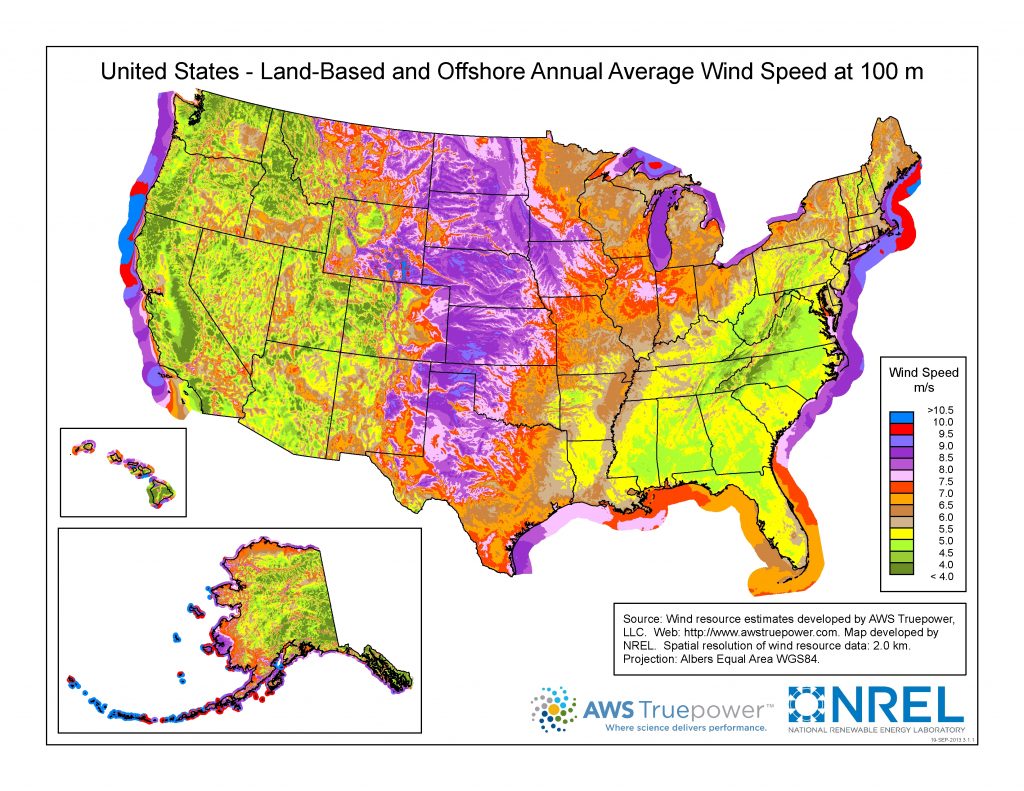
- Identify the parts of the US with the greatest wind resource.
- List advantages and disadvantages of wind energy.
The sun heats different locations on Earth unequally. Warm air warm and cooler air takes its place. The movement of air from one spot to another along the ground creates wind, a potential source of energy. Since wind is a result of solar energy wind is renewable.
Wind turbines are often mistakenly called ‘windmills,’ though they do not mill or grind anything. Wind turbines do not release carbon dioxide or toxic emissions during the production of power unlike fossil fuel plants. They do not create radioactive waste. Unlike all fossil fuel plants, geothermal, and nuclear, wind turbines to not require water for cooling.
Video 10.11.1 – How Do Wind Turbines Work? TED-Ed (5:00)
At the end of 2020, the US had 135,225 MW of wind power capacity. At a capacity factor of 35%, the power generated by wind in the US in 2020 was equivalent to 13.5 Palo Verde Nuclear Generating Stations, all without using water, releasing emissions, or creating radioactive waste. While all power plants use resources in construction, most of the products that go into a wind turbine can be recycled. The fuel is free. Though some early turbine blades were buried in landfills, blades now are being recycled by being ground up and mixed into cement, adding strength to the product, or by being reprocessed. As blades are expected to account for 43 million metric tons of waste in 2050, this is important. Most old turbine blades should be able to be repressed for reuse. For comparison, coal ash waste from US power plants in 2010 was 212,000,000 tons. About 40% of that was reused in the making of cement and other products. The rest, containing toxic elements, was placed in pits, many of which leaks into our groundwater.
According to the American Wind Energy Association (AWEA), over 35% of all new electrical generating capacity in the United States since 2006 is from wind.
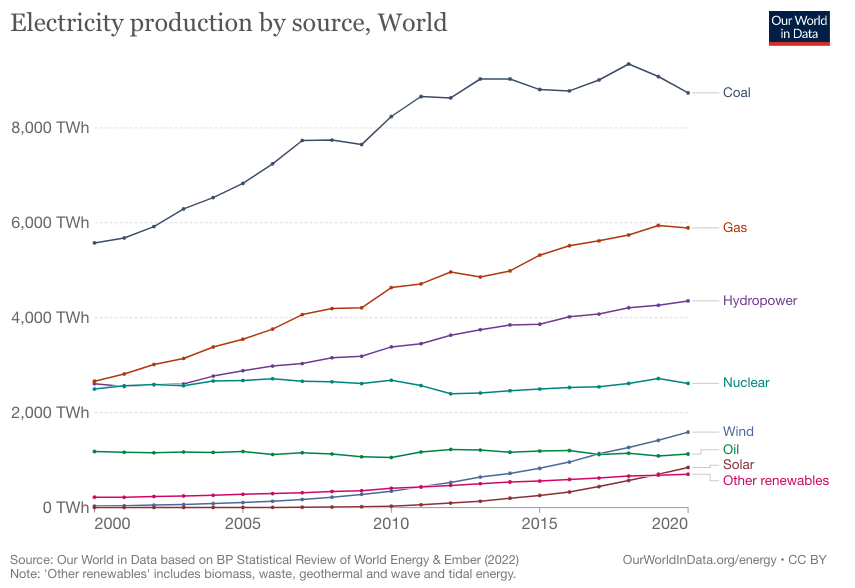
As shown below, wind power is not the highest producer of electricity but is the fastest growing energy source in the world. From almost nothing 20 years ago, wind now produces more than 50% of the electricity produced by nuclear power even though nuclear power has been around for 60 years.
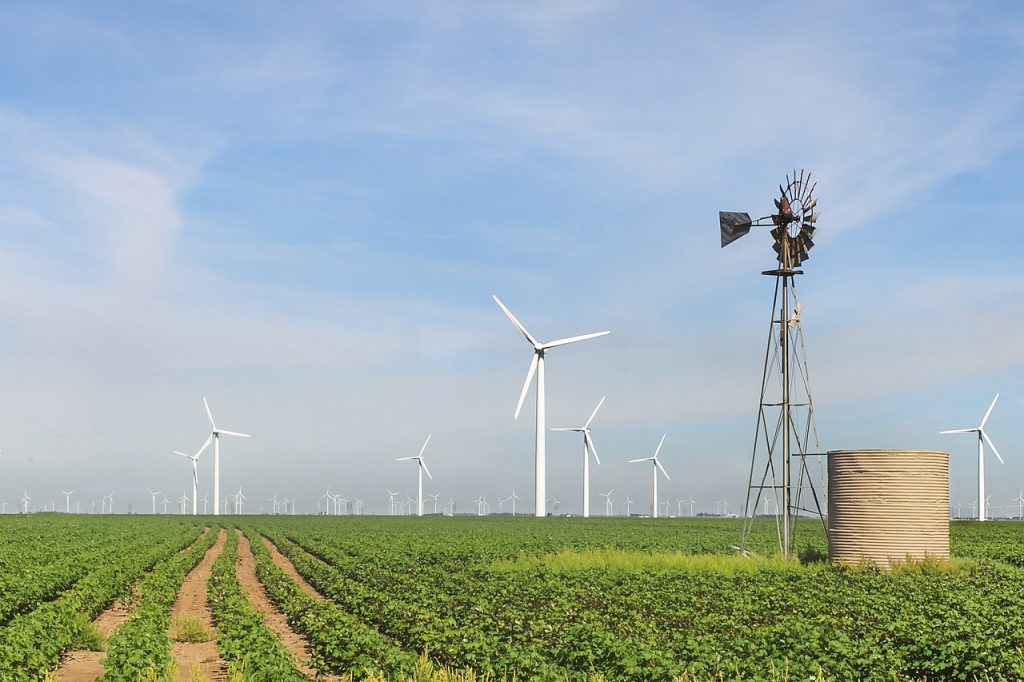
Wind turbines are now seen in many locations either individually or in large fields as at the Roscoe Wind farm in Texas. The Roscoe field (Google Earth) cost ~$1 billion to build, has a capacity factor of ~32% and a capacity of 781.5 MW, providing power for more than 250,000 average Texan homes. Cliff Etheredge, a local cotton farmer, helped to organize the project in which up to 400 individual land owners share in royalties paying up to $15,000/turbine/year. In addition, wind farms pay local taxes and are helping to revive the local economy in remote areas of West Texas and the Texas Panhandle.
California, an early adopter of wind power, has turbines in mountain passes where the cooler Pacific Ocean air moves back and forth through inland valleys. Large fields of wind turbines can be seen at Altamont Pass in the eastern San Francisco Bay Area, San Gorgonio Pass east of Los Angeles, and Tehachapi Pass at the south end of the San Joaquin Valley.
Arizona has several wind farms including the Dry Lake facility south of Holbrook and the Kingman Wind Farm for a total of 122,478 MW. The power produced by a wind turbine is often proportional to its height. Arizona has the potential to install up to 10.9 GW at 80 meters of height, 74.4 GW at 110 meters, or 191.0 GW at 140 meter hub height. The latter would generate 585 TWh (terawatt hours or 1000 GWh or 1,000,000 MWh or 1,000,000,000 kWh) annually, about 9X all the electricity Arizona used in 2005.
According to the USDOE, each 1000 MW of wind power capacity installed in Arizona will save 818 million gallons of water per year and eliminate 2.0 million tons of carbon dioxide emissions as wind turbines, unlike fossil fuel, nuclear, or geothermal plants do not require cooling water and do not release CO2 in the production of electricity. As Phase 1 of Arizona’s Dry Lake project was 63 MW, this wind farm alone will eliminate 126,000 tons of CO2 and save 51,000,000 gallons of water annually. [LINK]

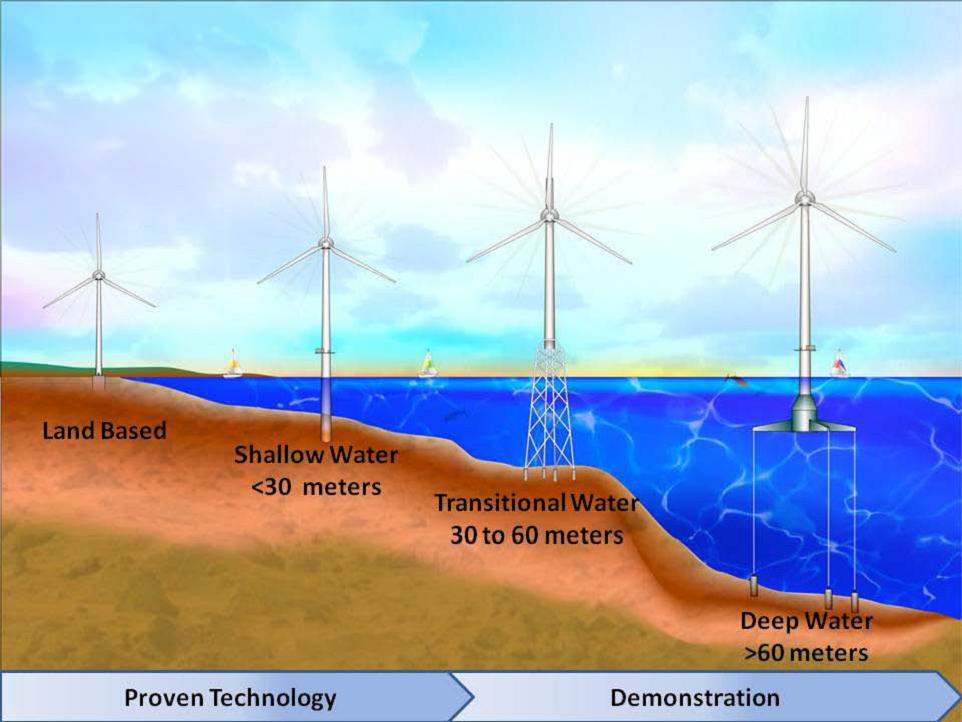
So far we have discussed only land-based wind, but the potential of off-shore wind power is even greater than land-based wind as shown below. This is because coastlines are areas of unequal heating with consistent winds. In addition but not always, the not-in-my-backyard (NIMBY) complaint is reduced. As the larger population centers are along the coasts, running power could be easier as there won’t be a fight over power line rights of way. Many jurisdictions want power but don’t want power lines. Offshore wind may solve this issue, at least in part.

The potential for power from offshore turbines is greater not only because winds are more consistent resulting in a higher capacity factor (running more of the time ), but because larger wind turbines can be built on the continental shelves as shown below. The turbine support structures are like oil platforms and can provide some habitat for sea life, though other than an occasional small leak, they do not spill 210,000,000 barrels of oil into the ocean like the Deepwater Horizon incident in 2010.
As of 2020 the total worldwide offshore wind power nameplate capacity was 35.3 gigawatt (GW).United Kingdom (29%), China (28%) and Germany (22%) account for more than 75% of the global installed capacity. The 1.2 GW Hornsea Project One in the United Kingdom was the world’s largest offshore wind farm but larger projects such as the 2.4 GW Greater Changhua in Taiwan are being built. [LINK]
Offshore wind power in Europe is now cheaper than conventional power sources and is a a significant part of northern Europe power generation, though <1% of overall world electricity generation as of 2020.
A big advantage of offshore wind power compared to onshore wind power is the higher capacity factor meaning that an installation of given nameplate capacity will produce more electricity at a site with more consistent and stronger wind which is usually found offshore and only at very few specific points onshore. [LINK]
Advantages of Wind Power
1. Wind power in the production of electricity does not release carbon dioxide.
2. Wind power in the production of electricity does not release particulates or toxins.
3. The fuel is free.
4. It is among the cheapest forms of electricity.
5. Wind energy alone can power the US and the world many times over.
6. Wind power technology is improving.
7. Wind power makes extra money for farmers and ranchers and supports the local tax base.
8. Wind power is local. We don’t need to get it from other countries. We don’t need a large military to ensure its flow.
9. Wind power is renewable.
Disadvantages of Wind Power
1. Wind can be intermittent.
2. Some residents complain about the loss of a nice view or noise – NIMBYism.
