
12.7 Anthropogenic Climate Change
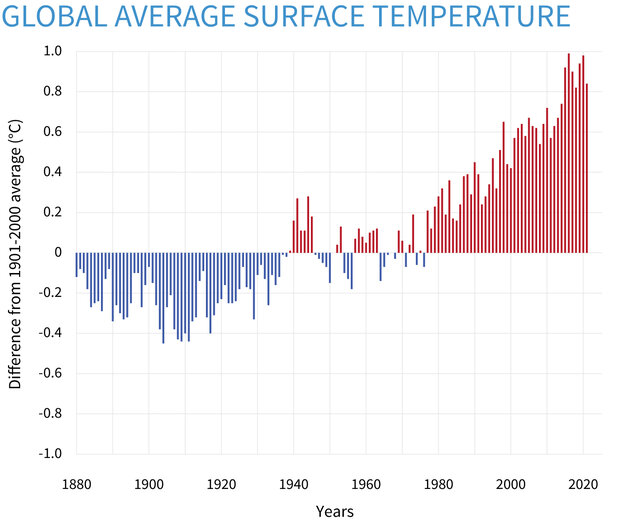
The scientific consensus is clear, in that most scientists who directly study climates and climate change state that the current warming of the planet is anthropogenic. Moreover, all the scientific evidence and vital planetary signs indicate that more greenhouse gases are trapping Earth’s heat, causing average annual global temperatures to rise. While temperatures have risen since the end of the Pleistocene, roughly 10,000 years ago, most of the warming has occurred since 1900. The nine warmest years on record have all occurred since 1998, and NASA and NOAA reported in 2019 that the year 2018 was the fourth warmest ever recorded on the planet. (2019 Was 2nd Hottest Year on Record for Earth Say NOAA, NASA | National Oceanic and Atmospheric Administration, n.d.) It has now been determined that 2010-2020 was the warmest decade on record, followed by 2000-2010.
The United States has long been the largest emitter of greenhouse gases, with about 20 percent of total emissions. As a result of China’s rapid economic growth, its emissions surpassed those of the United States in 2008. However, it is also essential to keep in mind that the United States has only about one-fifth of China’s population. What is the significance of this? The average United States citizen produces far more greenhouse gases than the average Chinese person. (Dastrup et al., 2019)
Predicting Future Warming
Climate change can be a naturally occurring process and has created environments much warmer than today, such as the early Cretaceous period. During this time, life thrived even in regions, such as the interior of Antarctica, which is uninhabitable today.
One misconception is that the threat of climate change has to do with the absolute warmth of the Earth. The concern more for scientists has to do with the rate of change of that temperature increase. Living organisms, including humans, can quickly adapt to substantial changes in climate if the changes take place slowly, over thousands of years. However, adapting to changes that are taking place on timescales of decades is far more challenging. The Earth is warming at such a rate that most species will struggle to adapt and evolve quickly enough to the coming warmer climates.
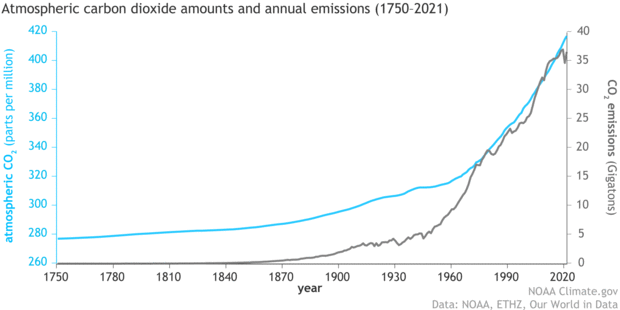
The natural increase in atmospheric carbon dioxide that led to the thaw after the last Ice Age was an increase from 180 parts per million (ppm) to about 280 ppm. This was a smaller increase than the present-time increase due to human activities, such as fossil fuel burning, which thus far has raised carbon dioxide levels from the pre-industrial value of 280 ppm to a current level of over 410 ppm, a level which is increasing by 2 ppm every year. If the dawn of industrialization had occurred 18,000 years ago, we might have sent the climate from an ice age into the modern pre-industrial state.
How long it would have taken to melt all of the ice is not precisely known, but it is conceivable it could have happened over a period as short as two centuries. The area ultimately flooded would be considerably more significant than that currently projected to flood due to the human-caused elevation of carbon dioxide that has taken place so far. (Dastrup et al., 2019)
The amount of carbon dioxide levels will continue to rise in the decades to come. However, the impacts will not be evenly distributed across the planet. Those impacts will depend on environmental and climate factors; other impacts will depend on whether the countries are developed or emerging. Climatologists and other scientists use sophisticated computer models to predict the causes, effects, and impacts of greenhouse gas increase on climate systems globally, and for specific regions of the world. (Dastrup et al., 2019)
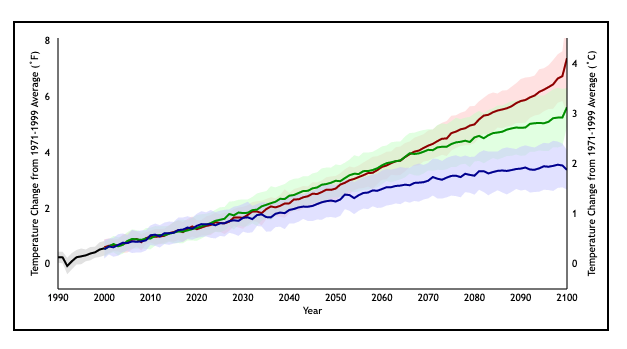
If nothing is done to control greenhouse gas emissions, and they continue to increase at current rates, the surface temperature of the Earth can be expected to increase between 0.5 to 2.0 degrees Celsius (0.9 to 3.6 degrees Fahrenheit) by 2050, and between 2 to 4.5 degrees Celsius (3.5 to 8 degrees Fahrenheit) by 2100, with carbon dioxide levels over 800 ppm.
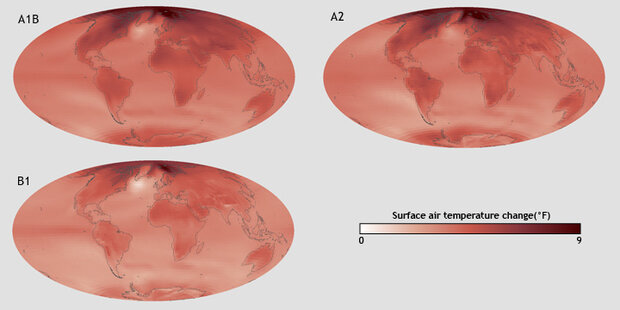
Whatever the temperature increase, it will not be uniform around the globe. A rise of 2.8 degrees Celsius (5 degrees Fahrenheit) would result in 0.6-1.2 degrees Celsius (1 to 2 degrees Fahrenheit) at the equator, but up to 6.7 degrees Celsius (12 degrees Fahrenheit) at the poles. Climate change has affected the North Pole more than the South Pole, but temperatures are still increasing in Antarctica.
Effects of Anthropogenic Climate Change
There are a variety of possibilities and the effects of climate change on human and natural environments. NASA has tried to list some of those potential effects and can be found here. NASA also has a website called the Climate Time Machine, to help visualize Earth’s key climate indicators and how they are changing over time.
Species Mating and Migration
The timing of events for species is changing. Mating and migrations are starting to occur earlier in the spring months, and species that are more mobile are migrating to cooler temperatures and more abundant water. Some regions that were already marginal for agriculture are no longer farmable because they have become too warm or dry.
Melting Snowpack and Glaciers
Decreased snowpacks, shrinking glaciers, and the earlier arrival of spring will lessen the amount of water available in some regions of the world, including the western United States and much of Asia. Ice will continue to melt, and sea level is predicted to rise 18 to 97 cm (7 to 38 inches) by 2100. An increase this large will gradually flood coastal regions where about one-third of the world’s population lives, forcing millions of people to move inland.
Glaciers are melting, and vegetation zones are moving uphill. If fossil fuel use exploded in the 1950s, why do these changes begin early in the animation? Does this mean that the climate change we see is caused by natural processes and not by fossil fuel use?
Oceans and Rising Sea Levels
As greenhouse gases increase, changes will be more extreme. Oceans will become slightly more acidic, making it more difficult for creatures with carbonate shells to grow, and that includes coral reefs. A study monitoring ocean acidity in the Pacific Northwest found ocean acidity increasing ten times faster than expected, and 10 to 20 percent of shellfish (mussels) being replaced by acid-tolerant algae.
Plant and animal species seeking cooler temperatures will need to move poleward 100 to 150 km (60 to 90 miles) or upward 150 m (500 feet) for each 1.0 degrees Celsius (8 degrees Fahrenheit) rise in global temperature. There will be a tremendous loss of biodiversity because forest species cannot migrate that rapidly. Biologists have already documented the extinction of high-altitude species that have nowhere higher to go.
One may notice that the numerical predictions above contain wide ranges. Sea level, for example, is expected to rise somewhere between 18 and 97 centimeters by 2100. The reason for this uncertainty is that scientists cannot precisely predict how the Earth will respond to increased levels of greenhouse gases. How quickly greenhouse gases continue to build up in the atmosphere depends in part on the choices we make. (Dastrup et al., 2019)
Extreme Weather
Weather will become more extreme with heatwaves and droughts. Sophisticated computer models predict that the Midwestern United States will become too dry to support agriculture and that Canada will become the new breadbasket. In all, about 10 to 50 percent of current cropland worldwide may become unusable if carbon dioxide doubles. Global monitoring systems help monitor potential droughts that could turn into famines if they occur in politically and socially unstable regions of the world and if appropriate action is not taken in time. One example is the Famine Early Warning System Network (FEWS NET), a network of social and environmental scientists using geospatial technology to monitor these situations. However, even with proper monitoring, if nations do not act, catastrophes can occur like in Somalia from 2010-2012.
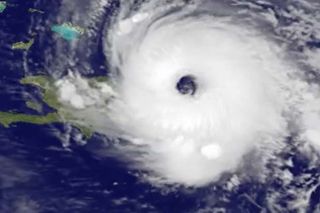
Although scientists do not all agree, hurricanes are likely to become more severe and more frequent. Tropical and subtropical insects will expand their ranges, resulting in the spread of tropical diseases such as malaria, encephalitis, yellow fever, and dengue fever.
An important question people ask is this: Are the increases in global temperature natural? In other words, can natural variations in temperature account for the increase in temperature that we see? The scientific data shows no, natural variations cannot explain the dramatic increase in global temperatures. Changes in the sun’s irradiance, El Niño and La Niña cycles, natural changes in greenhouse gas, plate tectonics, and the Milankovitch Cycles cannot account for the increase in temperature that has already happened in the past decades. (Dastrup et al., 2019)
Changing the Climate Change Narrative
However, it is essential to get a sound, data-driven understanding of climate change. Along with the IPCC, other organizations like the United Nations Environmental Programme (UNEP), World Health Organizations, World Meteorological Organization (WMO), National Aeronautics and Space Administration (NASA), the National Oceanic and Atmospheric Administration (NOAA), and the U.S. Environmental Protection Agency (EPA).
Climate Timeline
The following is a climate timeline designed by the comic strip XKCD, while made to be funny, the data are real. Review this timeline before opening the H5P content below.

Figure 12.8.1: “Climate Timeline” by XKCD is licensed as Public Domain.
