
12.6 Long-Term Climate Change
To have an intelligent and fact-driven conversation about the planet’s current warming, one must have a strong understanding of the natural causes, processes, and cycles of naturally occurring climate change. Sophisticated climate models analyze these natural processes and cycles to analyze past, present, and future climate trends and patterns.
Plate Tectonics
As noted in the textbook regarding the theory of plate tectonics, tectonic plates are moving around the Earth’s surface because of convection within the mantle. This is the driving force of mountain building, earthquakes, and volcanoes around the planet. However, the movement of tectonic plates can also alter regional and global climates.

Over millions of years, as seas open and close, ocean currents may distribute heat differently across the planet. For example, when all the continents are together as one supercontinent (such as Pangaea), nearly all location experiences a continental climate. When the continents separate, heat is more evenly distributed.
Plate tectonic movements can also contribute or even start an ice age. When continents are near the poles, ice can accumulate, which may increase albedo and lower global temperature to start a global ice age.
Tectonic plate motions can trigger volcanic eruptions, which may release dust and carbon dioxide into the atmosphere. Frequent eruptions, even large ones, have only a short-term effect on weather. However, massive volcanic eruptions can create lava plateaus, releasing vast quantities of carbon dioxide that can change the climate for years or decades. This type of eruption is exceedingly rare and has not occurred in human history.
Milankovitch Cycles

The most extreme climate of recent Earth history was the Pleistocene. Scientists attribute a series of ice ages to variations in Earth’s position relative to the sun, known as Milankovitch cycles. The Earth goes through regular variations in its position compared to the sun.
The shape of the Earth’s orbit changes slightly as it goes around the sun, called eccentricity. The orbit varies from more circular to more elliptical in a cycle lasting between 90,000 and 100,000 years. When the orbit is more elliptical, there is a more significant difference in solar radiation between winter and summer.
The Earth also wobbles on its axis of rotation, called precession. At one extreme of this 27,000-year cycle, the Northern Hemisphere points toward the sun when the Earth is closest to the sun. Summers are much warmer, and winters are much colder than now. At the opposite extreme, the Northern Hemisphere points toward the sun when it is farthest from the sun, resulting in cool summers and warmer winters.
The planet’s tilt on its axis varies between 22.1 degrees and 24.5 degrees, called obliquity, which has a 41,000-year cycle. Seasons are caused by the tilt of Earth’s axis of rotation, which is currently 23.5 degrees. When the tilt angle is smaller, summers and winters differ less in temperature. (Causes of Long-Term Climate Change | Physical Geography, n.d.)
Sun Variation
The amount of energy the sun radiates is relatively constant over geologic time but slightly fluctuates over the decades. Part of this fluctuation occurs because of sunspots, magnetic storms on the sun’s surface that increase and decrease over an 11-year cycle.
When the number of sunspots is high, solar radiation is also relatively high. However, the entire variation in solar radiation is tiny relative to the total amount of solar radiation, and there is no known 11-year cycle in climate variability. The Little Ice Age corresponded to a time when there were no sunspots on the sun. (Causes of Long-Term Climate Change | Physical Geography, n.d.)
Changes in Atmospheric Greenhouse Gas Levels
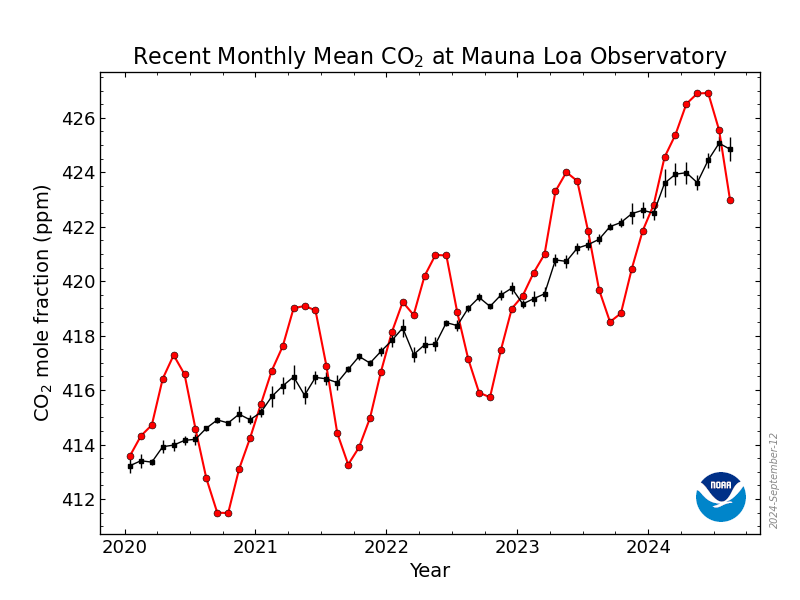
Climatic data from ice core drillings rings within coral reefs and trees, ocean and lake sediments, and other sources indicate that when greenhouse gasses increase in the atmosphere, global temperatures rise. When greenhouse gasses decrease in the atmosphere, global temperatures fall. In 1958, the National Oceanic and Atmospheric Administration (NOAA) began measuring carbon dioxide levels in real-time. What direct measurements of carbon dioxide in the atmosphere indicate is that every year, the concentration of the gas increases globally every six months and decreases six months later. This has mostly to do with the continents in the northern hemisphere, where the landmass and trees are located. During the warmer months, the trees in the northern hemisphere begin photosynthesizing by taking carbon dioxide out of the atmosphere and uses sunlight to create chlorophyll. This causes global greenhouse gases to decrease for six months. When the northern hemisphere experiences fall and winter, the trees stop photosynthesizing and become dormant, causing global greenhouse gases to increase. However, even though carbon dioxide levels increase and decrease every year, the global trend is that carbon dioxide levels are growing every year. Current measurements from NASA show that carbon dioxide levels are at 413 ppm, the highest the Earth has seen in nearly a million years. (NASA, n.d.)
Recently, NASA has created ultra-high-resolution computer models, giving scientists a data-driven visualization of carbon dioxide as it flows around the world.
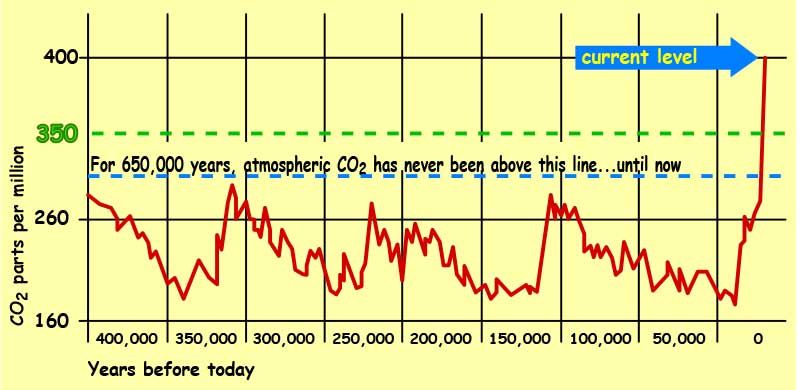
Greenhouse gas levels have varied throughout Earth history. For example, carbon dioxide has been present at concentrations of less than 200 parts per million (ppm) and higher levels than today. However, for at least 650,000 years, carbon dioxide has never risen above 300 ppm, during either glacial or interglacial periods. Natural processes add (volcanic eruptions and the decay or burning of organic matter) and remove absorption by plants, animal tissue, and the ocean) carbon dioxide from the atmosphere. When plants become a form of fossil fuel, the carbon dioxide in their tissue is stored with them, removing carbon dioxide from the atmosphere. (NASA, n.d.)
Fossil fuel use has skyrocketed in the past few decades more people want more cars and industrial products, releasing vast quantities of carbon dioxide into the atmosphere. Burning tropical rainforests, to clear land for agriculture, a practice called slash-and-burn agriculture, also increases atmospheric carbon dioxide. By cutting down trees, they can no longer remove carbon dioxide from the atmosphere. Burning the trees releases all the carbon dioxide stored in the trees into the atmosphere.
The atmosphere currently holds over 40 percent more carbon dioxide than it did during the Industrial Revolution. Approximately 65 percent of that increase has occurred since the first carbon dioxide measurements were made on Mauna Loa Volcano, Hawaii, in 1958. Carbon dioxide is a critical greenhouse that must monitor because of human activity. However, other greenhouse gases are increasing as well. (The Causes of Climate Change, n.d.) The primary greenhouse gases include:
- Water vapor (36 to 70 percent of total): is the most abundant and potent greenhouse gas on the planet and is part of the hydrologic cycle.
- Carbon dioxide (9 to 26 percent of total): released from the burning of fossil fuels.
- Methane (4 to 9 percent of total): released from raising livestock, rice production, and the incomplete burning of rainforest plants.
- Tropospheric ozone (3 to 7 percent of total): from vehicle exhaust, it has more than doubled since 1976.
