
1 10.8 Hydroelectricity – Dams, Run-Of-River, and Tidal
Jeff Simpson and Carolina Londono Michel
Learning Objectives – By the end of this chapter, you should be able to do the following.
- Explain how electricity is produced from hydroelectric dams, run-of river installations, and tidal power plants.
- Explain how most hydropower really is solar power.
- Explain the difference between run-of-river and typical hydroelectric installations.
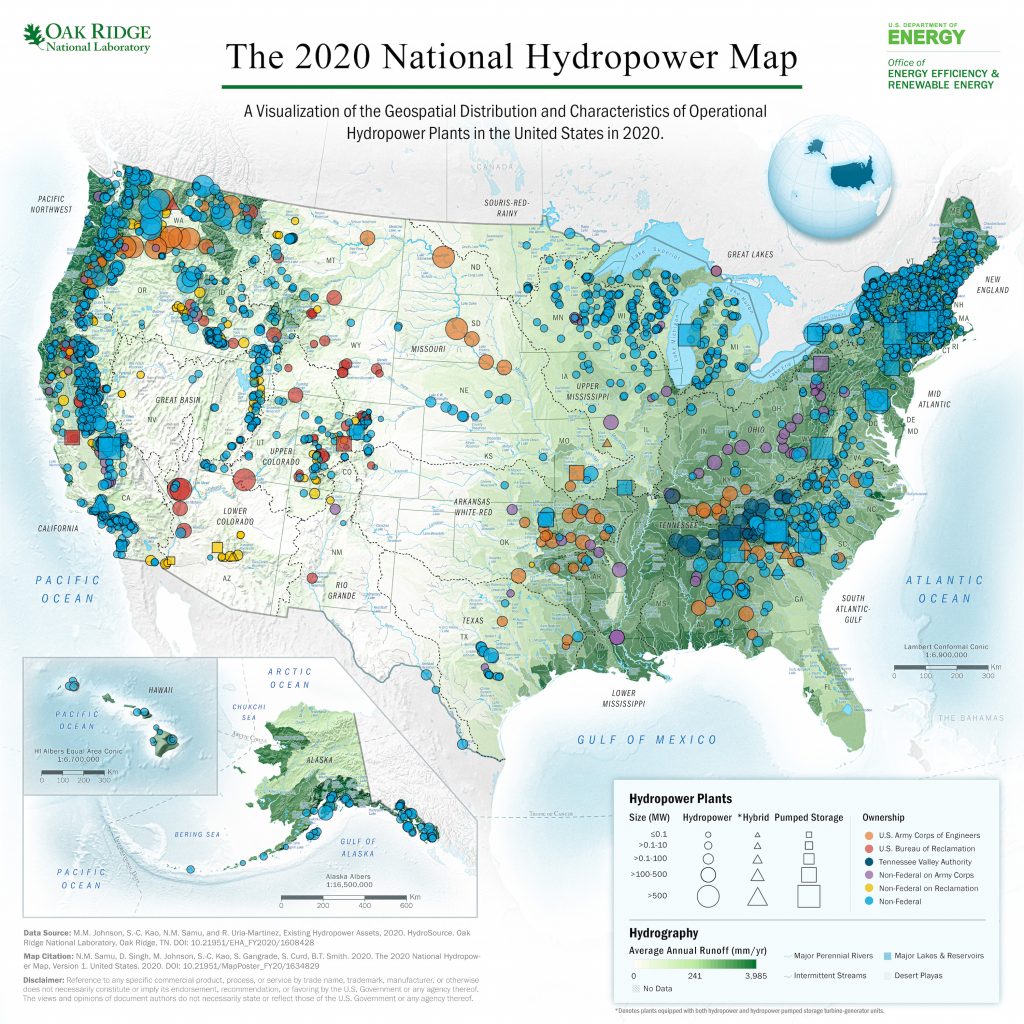
- Identify locations in Arizona, the US, and the world with hydropower and tidal power potential or installations.
- List advantages and disadvantages of conventional hydropower, run-of-river, and ocean/tidal energy.
Hydropower or hydroelectricity comes in three forms: 1) large dams, 2) run-of-river, and 3) tidal.
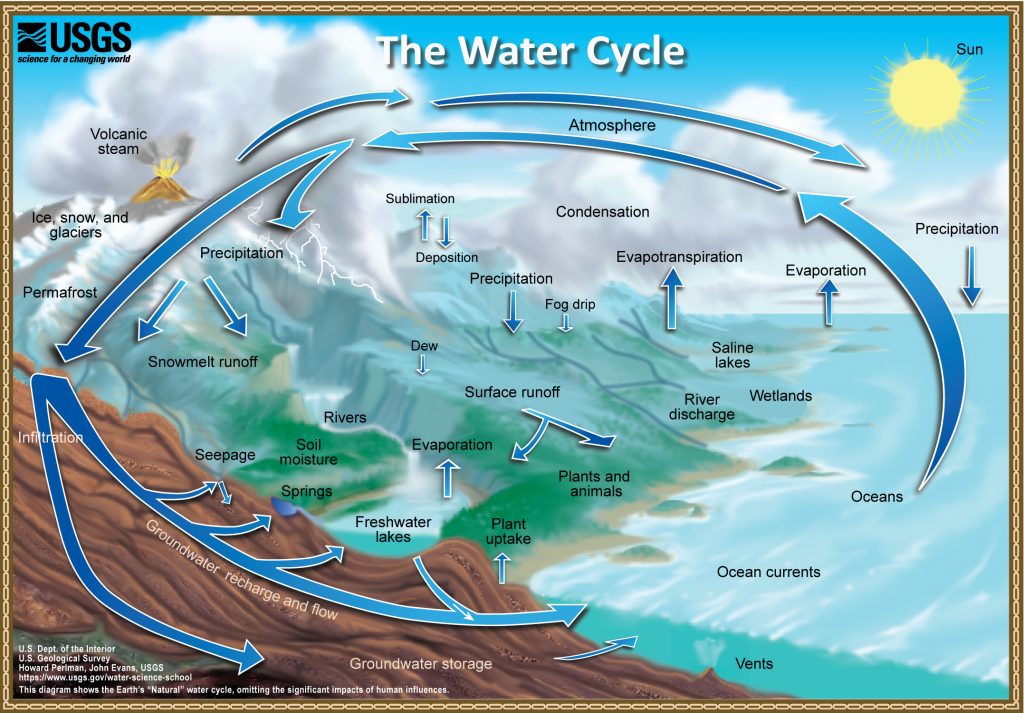
The first two forms – large dams and run-of-river – are indirect solar energy. How? The sun evaporates or lifts an average of 1 meter of water / year from Earth’s surface. (LINK) Imagine you lifting just one cubic meter of water weighing about 2,200 pounds (1,000 kg or 1 metric tonne, slightly more the traditional American 2000 pound ton) up 30,000′ in the air. That is a lot of stored energy. The evaporating water rises until it cools and condenses into cloud droplets, eventually falling as precipitation to become surface water. That surface water runs in rivers downhill into lakes, reservoirs, and eventually back into the ocean, evaporates into the air, sinks into the ground, or evaporates from trees in a process called transpiration.
Tidal energy is driven by the gravitational pull of both the moon and the sun on Earth’s waters as Earth rotates rather than the energy from the sun.
Video 10.8.1 – Hydropower 101 (3:13)


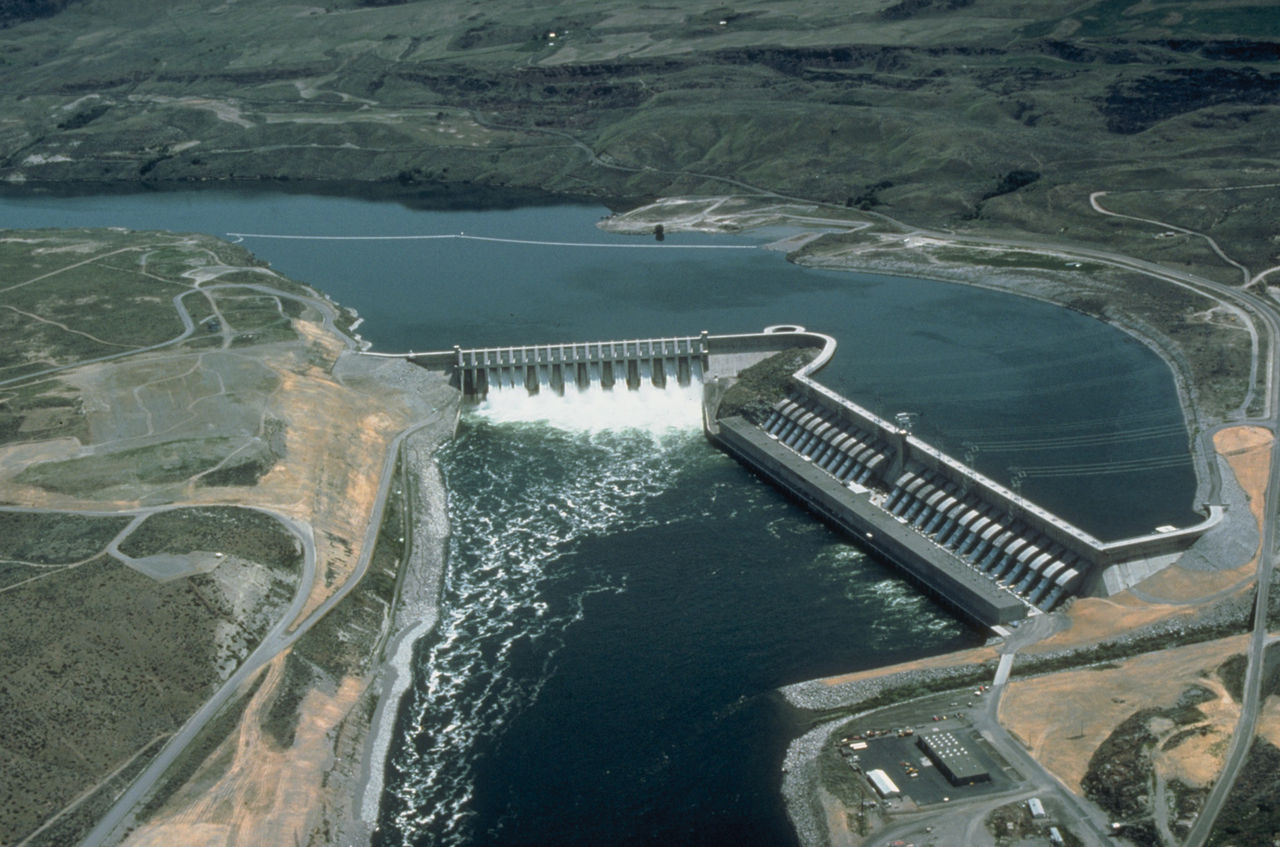
Dams
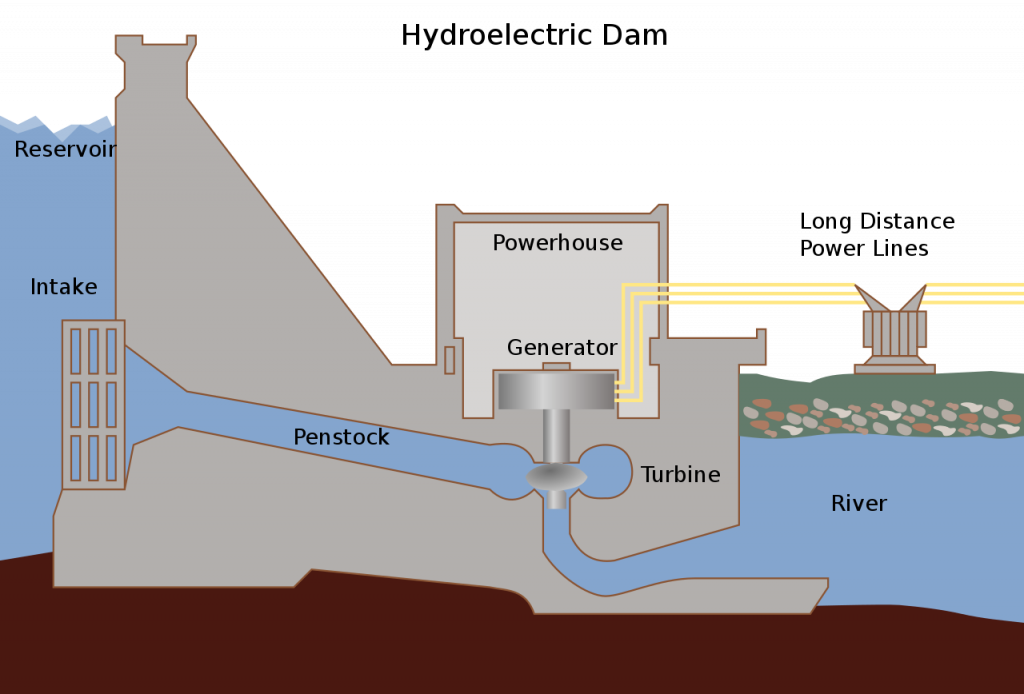
Hydroelectric dams are expensive to build initially, but the “fuel” – the falling water – is free, so a kilowatt hour of electricity from most dams is among the lowest of all energy sources and also is carbon-free. [LINK]. While the electricity itself may be carbon-free, the concrete in the dam is not. Concrete is created by heating limestone (CaCO3) until CO2 is driven off. That is one course of carbon being released to the atmosphere. In addition, the energy used to heat the limestone often comes from carbon-releasing sources.
Hydropower is both a good base load power supply and a good peaking resource. Base load is the minimum power required from the electric grid, usually occurring in the early morning hours. In addition, electricity from a dam is valued by utilities as the dam can respond in seconds to increased demand for electricity on the grid. In Arizona summers, this is handy in the late afternoon when power output from solar is dropping off but the demand for power to run air conditioners continues until the later evening. This is not true of utility sized coal plants which can take several hours to reach full capacity. Nuclear plants in the US typically do not “ramp” up and down either, instead operating at a steady output. Unless solar and wind are coupled with storage, they, too, are not considered caseload power.
Hydropower is often considered a greenhouse gas-free power source, but that is accurate only in the production of the electricity. When forests are covered by water rising behind a newly-built dam, the carbon in those drowned forests becomes a source of methane (CH4)as the trees rot in the absence of oxygen. In tropical areas, “where the reservoir is large compared to the generating capacity (less than 100 watts per square meter of surface area) and no clearing of the forests in the area was undertaken prior to impoundment of the reservoir, greenhouse gas emissions from the reservoir may be higher than those of a conventional oil-fired thermal generation plant.” [LINK]. Any claim that hydroelectricity is carbon- and greenhouse gas-free is true on the surface and the surface only. In geology, we try to look deeply and honestly.
However, in reservoirs of Canada and Northern Europe, greenhouse gas emissions from reservoirs typically are only 2-8% of conventional fossil-fuel thermal generation. A new class of underwater logging operation that targets drowned forests can mitigate the effect of underwater forest decay. [LINK]
Reservoirs created by dams often cover cultural sites, flood farmlands and require the relocation of populations. However, the dam controls water releases, protecting people downstream, too.
While small and lower dams have less environmental impact, higher dams store more water. The higher the level of the water above the intake, the greater the power than can be produced. This should not be a surprise. Contrast the pressure on your ears when you dive 2′ under the surface of the ocean vs. going 30′ under. More depth = more pressure = more power. In addition, the more water that is stored behind the dam, the more electricity that can be produced.

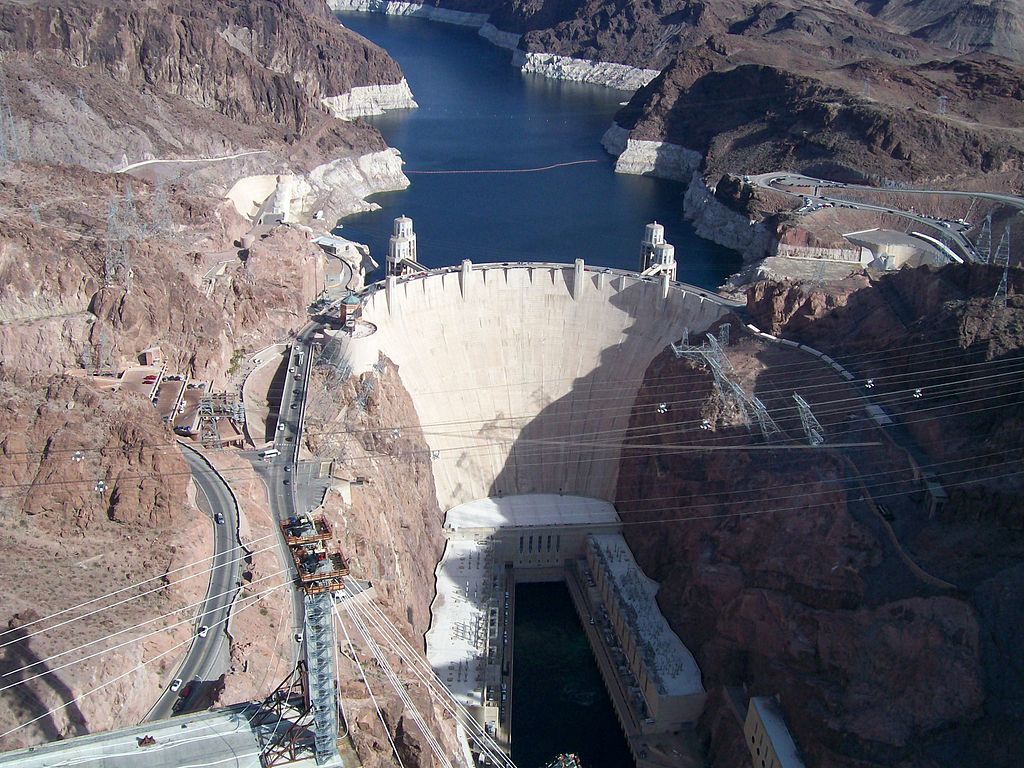
Large hydroelectric dams like the 710′ high Glen Canyon Dam that forms Lake Powell on the border of Arizona and Utah create vast reservoirs that can store water for times of drought. These reservoirs also serve to moderate flooding from spring runoff. The runoff that might have flooded areas downstream before the dam was built now can be held in the reservoir and released a little at a time, producing electricity as it passes through the dam’s generators.
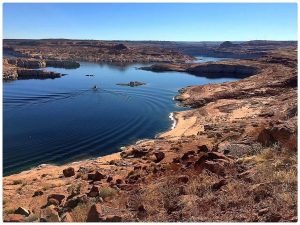
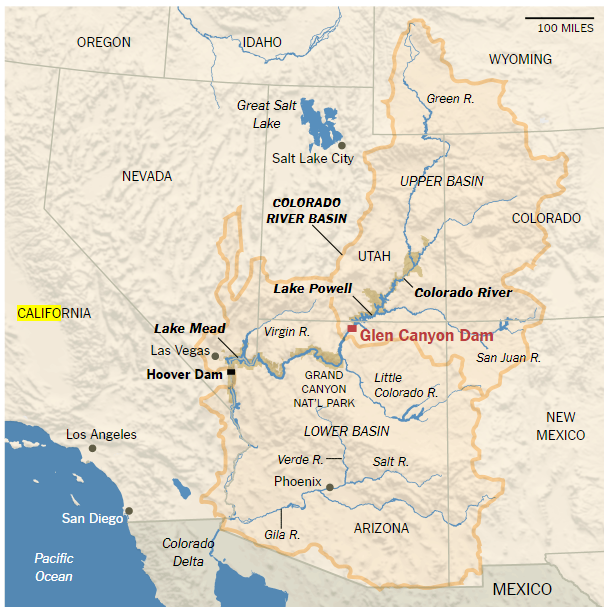
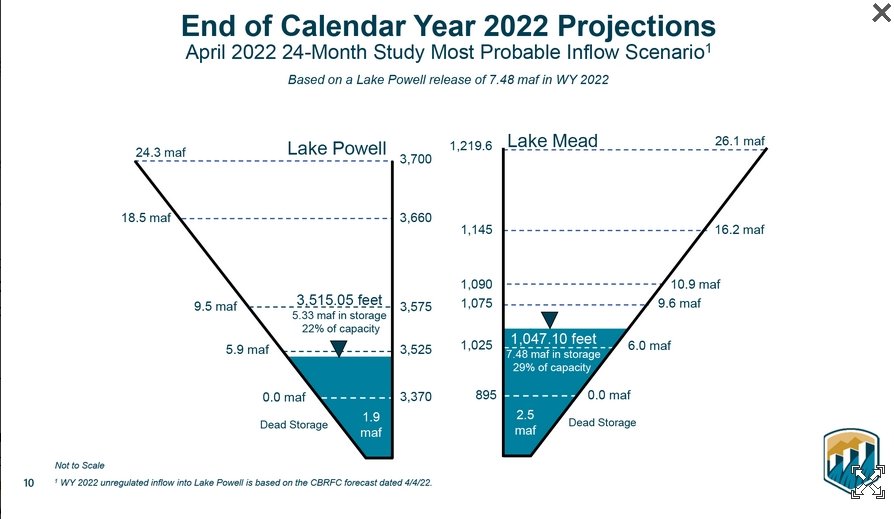
When full, Lake Powell on the Arizona-Utah border can store ~25 million acre feet of water. (An acre foot is the amount of water in an area one foot deep and 1 acre in area.) However, with climate change leading to a prolonged drought in the southwest United States, the volume of water in Lake Powell has dropped to less than 6,000,000 acre feet. Each year now, Lake Powell loses about 100,000 acre feet of water storage volume due to silting – the filling of the lake with sediments coming from upstream. At this rate, Lake Powell will be silted in in only 60 years and will stop producing power long before that. This is much less than the original 600-year predicted lifetime from the 1960s. Arizona’s Lake Mead will suffer the same fate, too, though a bit more slowly as Lake Powell traps the sediments upstream before they go through the Grand Canyon into Lake Mead.
This same fate awaits all reservoirs.
The sediments trapped behind dams no longer go downstream. Because of this, beaches that once were nourished by river sand are now being eaten aways by the ocean. Coastal features and structures that were once protected by those beaches will be at increased risk.
Downstream from a dam, farms that once relied on yearly deposits of flood-borne silt will be deprived of that nutrient-rich water and may have to rely on energy intensive synthetic fertilizers that most often are made from fossil fuels.
An interesting new use of reservoirs is as a host for floating solar or photovoltaic panelsr. Research presented at the Geological Society of America in 2017 indicated that covering 1/6 of the water surface of a reservoir with solar panels would produce the same amount of electricity as the dam itself. The panels are more efficient when cooled by the water (due to evaporation) and prevent some evaporation from the reservoir.
As the video above discussed, by using excess carbon-free electricity generated by the sun or wind, water from below the dam can be pumped back up behind the dam to be stored for times of increased demand as is done at Raccoon Mountain, Tennessee.
Large dams change the ecosystems of the river upstream and downstream. Upstream organisms that relied on oxygenated nning water may suffer when their former habitat is now still, de-oxygenated water as flowing water has a higher oxygen content than still water. The food supply will change. Organisms that relied on those organisms may struggle.
Impacts also occur downstream. Prior to completion of Glen Canyon Dam in 1963, the temperature of water flowing through the Grand Canyon each year was highly variable, ranging from the icy, spring run-off to the warm, 85-degree summer-heated flows. Once the Glen Canyon Dam was constructed, the temperature of the water released from the dam – drawn from the depths of Lake Powell and released through the dam’s penstock intakes – ranged for many years between 45° and 50° F. With the lowering of Lake Powell, release temperatures have been increased to as high as 59° F which has likely led to an increase in the humpback chub and other native fish populations in Grand Canyon. [LINK].
Dam failures do occur, though not frequently. Italy’s Vajont Dam failed in 1963 killing 1913 people downstream. Banqian Dam in China failed in 1975 killing 26,000 from flooding and another 145,000 dead from subsequent famine and epidemics. Eleven million people were left homeless.
In the northwest United States, salmon populations have been reduced by 55% by dams as the salmon can’t move upstream to spawn. Efforts to build “fish ladders” which allow the salmon to move upstream past the dam as well as other efforts have met with limited success. [LINK]
The Elwha River on the Olympic Peninsula Washington was dammed from 1911 to 2014. Before the dams, 400,000 adult salmon returned yearly to spawn in 70 miles of river habitat. By the 2010s, fewer than 4,000 salmon returned each year and in only 4.9 miles of habitat below the lower dam. From 2011-2014, the US National Park Service removed two dams as part of the Elwha Ecosystem Restoration Project. The river has already carried sediment to its mouth, creating 70 acres of estuary habitat at the Strait of Juan de Fuca, renourishing beaches. Salmon are naturally recolonizing the 70 miles of river habitat in Olympic National Park. Because almost all of the Elwha’s watershed is in a national park, the river should become relatively pristine, with few of the issues of agricultural runoff and water heating that affect other salmon river habitat in the Pacific Northwest. Projections by the Park Service show that up to 392,000 fish will fill 70 miles of habitat, theoretically matching the “pre-dam peak”. [LINK]
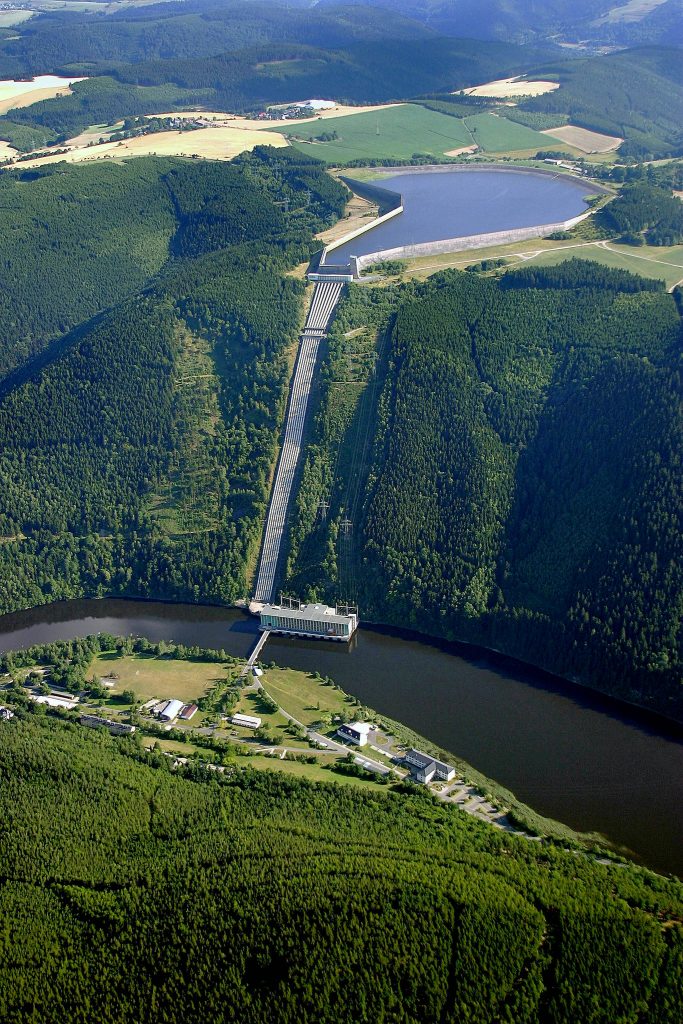
Run of River
In contrast to large dams, run-of-river hydroelectricity creates no large reservoir and may have no storage at all and therefore is subject to seasonal flows. Run-of-river is is a good fit for locations that receive a constant supply of rain or where a constant electricity supply is not required. Run-of-river does not provide flood control but may provide some diversion for agricultural use.
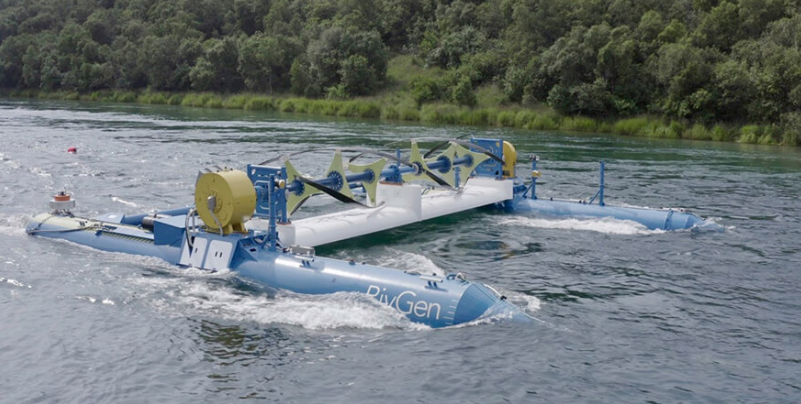
As is common with new technologies, they often are tried out first in places where power is more expensive. One example of this is a village of in Alaska which has relied for years on imported diesel fuel. That village now is trying a run-of-river system. [LINK]
Tidal Power
Video 10.8.2 – Tidal Power 101 (2:18)
As with any technology, tidal power poses some challenges. Tidal power can affect marine life as the rotating blades can kill swimming sea life – blade strike. Some projects include a safety mechanism that turns off the turbine when marine animals approach, but that results in a major loss of energy. Some fish may avoid the area if threatened by a constantly rotating or noisy object.
Electromagnetism and sound may affect marine organisms. Acoustic output can be greater in water than air. (You can hear a boat coming toward you when under the surface of a lake.) This can be especially important for marine mammals such as dolphins and whales.
Tidal energy can degrade water quality and disrupt natural sediment processes. These effects can range from small traces of sediment building up near the tidal device to severely affecting nearshore ecosystems and processes. Saltwater is corrosive, making maintenance difficult. Lubricants can leak out and may be harmful to marine life.
But the biggest challenge related to tidal energy is the high initial cost. So far, only a few projects have succeeded. [LINK]. One of those successes is the French Rance Tidal Station, completed in 1966. The initial building costs have been recovered and the power produced by the tidal plant is 1.8 ¢/kWh versus 2.5 ¢/kWh for nuclear, though the tidal plant operates only 28% of the time – the capacity factor – while nuclear power operates with an 85–90% capacity factor. [LINK]
Advantages of Hydropower
1. Hydropower is among the cheapest forms of electricity.
2. Hydropower releases no greenhouse gases or particulates.
3. Hydropower reservoirs store water for later use, reduce downstream flooding, and allow for recreation.
4. Hydropower reservoirs can provide area for floating solar panels allowing for pumped hydro storage.
5. Hydropower is dispatchable; it can be turned on and off.
Disadvantages of Hydropower
1. The best hydropower locations have already been used. The largest rivers have been dammed.
2. Dams change a river’s ecosystem both upstream and downstream, affecting ecosystems, economies, and populations.
3. A dam in one country may affect the water and food supply in another country.
4. Reservoirs result in high evaporation losses.
5. Dams have a lifespan, filling up with silt.
6. In tropical areas, the flooded forests behind the dam may release more methane than a comparable fossil fuel plant.
7. Dams can fail causing major loss of life and property downstream.
8. In times of drought, no power can be produced.
9. Tidal power must deal with effects on the marine environment as well as corrosion and expense.
